10 Engineering Metrics Every Manager Must Track in 2026 (DORA + SPACE + DevEx)

McKinsey's 2023 developer productivity report found that engineers spend only 25-30% of their time writing code. The rest vanishes into meetings, context switching, and waiting. If you're an Engineering Manager relying on gut feeling, you're blind to where 70% of your team's capacity actually goes.
Here are 10 metrics that will sharpen your decisions. No fluff, no "track everything" advice — just the ones that separate informed management from guesswork.
{/* truncate */}
1. Activity Time (Actual Coding Hours)
What it is: Real time spent actively coding in the IDE, measured through editor heartbeats — not self-reported, not calendar-based.
Why it matters: Most managers have no idea how much their team actually codes. Our platform data across B2B engineering teams shows the median is 78 minutes per day. This aligns with McKinsey's finding that developers spend less than a third of their time on coding — the rest goes to meetings, communication, and process overhead.
How to use it:
- Don't use it to rank developers (a dev coding 30 min/day might be doing architecture work)
- Use it to detect anomalies — if a usually active developer drops to 10 min/day for a week, something's wrong
- Track the team average over time, not individual numbers
Benchmark: 1-2 hours/day of pure coding is normal for a developer who also does reviews, meetings, and planning.
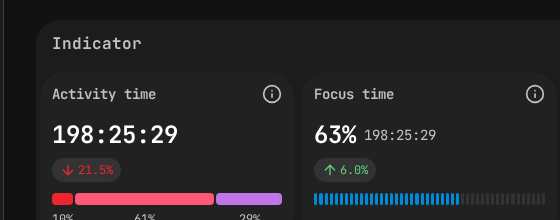 PanDev Metrics employee view — Activity Time (198h) and Focus Time (63%) at a glance.
2. Focus Time
What it is: Uninterrupted blocks of coding time — continuous work sessions without context switches between projects or long gaps.
Why it matters: Cal Newport's Deep Work research argues that most professionals can sustain at most 4 hours of deeply focused creative work per day. For developers, even that ceiling is hard to reach. Gloria Mark's research at UC Irvine found it takes an average of 23 minutes to refocus after a single interruption. A developer with two 90-minute focus blocks is far more productive than one with six 30-minute fragments spread across meetings.
How to use it:
- Audit your team's meeting schedule — are you breaking their focus blocks?
- Aim for at least one 2-hour uninterrupted block per developer per day
- Compare Focus Time across days — if Wednesdays show zero focus blocks, check the meeting calendar
Benchmark: If your developers have less than 1 hour of uninterrupted focus per day, your meeting culture is the problem.
3. Lead Time for Changes (with Stage Breakdown)
What it is: Time from first commit to production deployment, broken into stages: Coding → Pickup → Review → Deploy.
Why it matters: This is the single most actionable DORA metric. But only if you break it into stages.
How to use it:
- Coding stage too long? Tasks are too big. Break them into smaller PRs.
- Pickup stage too long? PRs sit unreviewed. Establish a "review within 4 hours" team norm.
- Review stage too long? Too many review rounds. Create a PR checklist to reduce back-and-forth.
- Deploy stage too long? CI/CD pipeline needs optimization. Talk to DevOps.
Benchmark (Elite teams): Total Lead Time under 1 day. Pickup time under 4 hours.
4. Deployment Frequency
What it is: How often your team ships code to production.
Why it matters: Frequent deploys = smaller changesets = lower risk = faster feedback. Teams that deploy daily find bugs in hours. Teams that deploy monthly find bugs in... the next month.
How to use it:
- Track the trend, not the absolute number
- If frequency is dropping, ask why — is it a complex feature, or is the process slowing down?
- Set a team goal (e.g., "at least 3 deploys per week")
Benchmark: High-performing teams deploy between daily and weekly.
5. Change Failure Rate
What it is: Percentage of deployments that cause production incidents (requiring hotfix, rollback, or patch).
Why it matters: It keeps deployment frequency honest. Deploying 10 times a day means nothing if 4 of those deployments break something.
How to use it:
- Track it alongside Deployment Frequency — they must improve together
- If failure rate spikes, review what changed — new team members? Reduced testing? Rushed deadline?
- A 0% failure rate is suspicious, not impressive. It usually means insufficient monitoring.
Benchmark: 5-10% is healthy. Below 5% is elite. Above 15% is a red flag.
6. Planning Accuracy
What it is: How close your team's estimates are to actual delivery time. The ratio of planned effort to actual effort.
Why it matters: Inaccurate planning creates a cascade: missed deadlines → scope cuts → unhappy stakeholders → pressure → more missed deadlines. Breaking this cycle starts with measuring it.
How to use it:
- Review at every retrospective
- Track which types of tasks are consistently underestimated (usually: integrations, migrations, "small" refactors)
- Use historical data to calibrate future estimates — "tasks like this typically take 1.5x our estimate"
Benchmark: A Planning Accuracy of 70-80% is good. Below 50% means your estimation process is broken.
7. Delivery Index
What it is: A velocity metric that measures development speed without relying on lines of code — factoring in complexity, commits, and delivery throughput.
Why it matters: Lines of code is a terrible metric (deleting code can be more valuable than writing it). Delivery Index gives you a velocity signal that actually correlates with output.
How to use it:
- Track weekly trends per team
- Compare a team to its own historical baseline, not to other teams
- A declining Delivery Index with stable Activity Time suggests increasing complexity or tech debt
8. MTTR (Mean Time to Restore)
What it is: Average time from a production incident to full recovery.
Why it matters: You can't prevent all incidents. But you can recover fast. An MTTR of 30 minutes means an incident is a hiccup. An MTTR of 3 days means it's a crisis.
How to use it:
- Run incident post-mortems and track MTTR for each
- Invest in detection (fast alerting) and recovery (feature flags, rollback automation)
- Set a team MTTR target and review monthly
Benchmark: Elite teams recover in under 1 hour. If your MTTR is over 1 day, prioritize observability and rollback mechanisms.
9. Cost per Project
What it is: The actual engineering cost of each project, calculated from developer time (tracked via IDE) multiplied by hourly rates.
Why it matters: When the CEO asks "how much did Feature X cost us?" most engineering leaders can't answer. This metric lets you respond with real numbers.
How to use it:
- Report to leadership with confidence — "Project Alpha cost $45,000 in engineering time over 6 weeks"
- Compare cost across projects to identify where engineering investment goes
- Use it for budgeting — historical cost data makes future estimates more accurate
Why most companies don't track it: Because it requires combining time tracking with financial data. PanDev Metrics does this automatically through IDE heartbeats + configurable hourly rates.
10. Team Productivity Trend (30-day)
What it is: A rolling 30-day view of your team's combined productivity score — accounting for activity, focus time, delivery index, and other factors.
Why it matters: Point-in-time metrics are noisy. Trends tell the story. A team trending down over 4 weeks needs attention. A team trending up is doing something right — find out what.
How to use it:
- Review in your weekly team sync
- Correlate dips with events (holidays, re-orgs, on-call rotations, crunch periods)
- Use it to detect burnout early — a gradual decline over weeks often signals overwork before the developer tells you
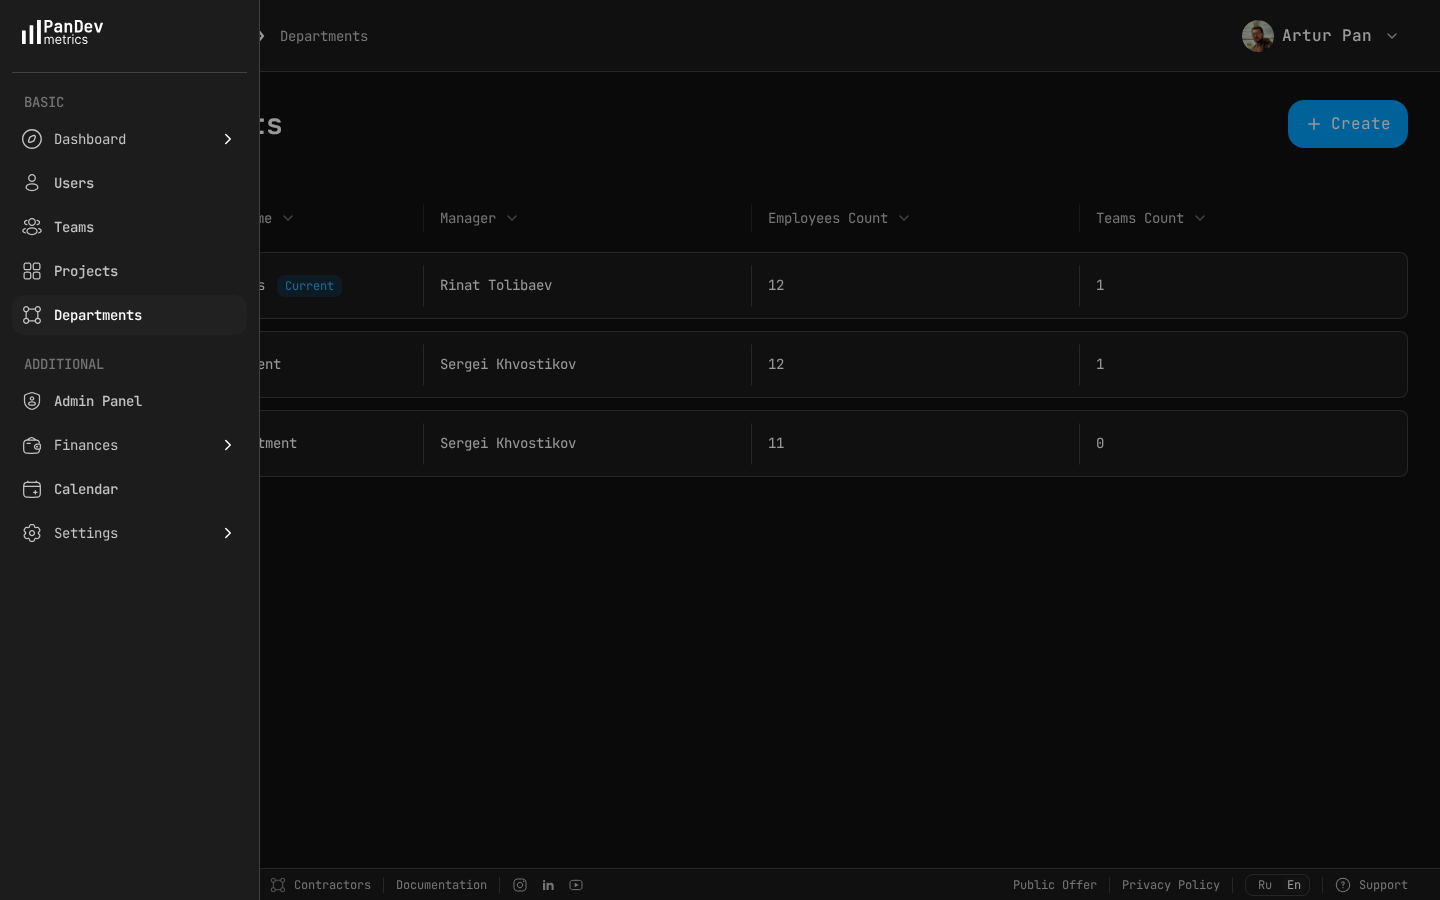 PanDev Metrics departments view — see how teams are structured, who manages each department, and where headcount is distributed.
The Anti-Metrics: What NOT to Track
| Metric | Why it's harmful |
|---|---|
| Lines of code | Incentivizes bloated code. Deleting code is often more valuable. |
| Commits per day | Incentivizes meaningless micro-commits. |
| Hours in office/online | Measures presence, not productivity. |
| Individual rankings | Creates competition instead of collaboration. |
| Story points velocity | Easily gamed, varies wildly between teams, meaningless for comparison. The SPACE framework (Forsgren et al., 2021) explicitly warns against using single activity metrics to evaluate individuals. |
"As a CTO and for our tech leads, it's important to see not individual employees but the state of the development process: where it's efficient and where it breaks down. The product allows natively collecting metrics right from the IDE, without feeling controlled or surveilled." — Maksim Popov, CTO ABR Tech (Forbes Kazakhstan, April 2026)
Building Your Dashboard
Start with these three. Add more only when you've acted on these:
Tier 1 (start here):
- Activity Time (team average)
- Lead Time with stage breakdown
- Deployment Frequency
Tier 2 (add after 1 month): 4. Focus Time 5. Change Failure Rate 6. Planning Accuracy
Tier 3 (add after 3 months): 7. Cost per Project 8. Delivery Index 9. MTTR 10. Team Productivity Trend
Benchmarks based on DORA State of DevOps Reports (Google Cloud, 2019-2023), SPACE framework (Forsgren et al., ACM Queue, 2021), McKinsey developer productivity report (2023), and PanDev Metrics platform data across B2B engineering organizations.
Track all 10 metrics from a single platform. PanDev Metrics connects to your IDE, Git provider, and task tracker — giving you a complete picture in one dashboard. Free to start.