The 10x Developer: What the Data Actually Shows (And Why It Doesn't Matter)

The "10x developer" is one of the most persistent myths in our industry — and one of the most damaging. Fred Brooks observed in The Mythical Man-Month (1975) that individual programmer productivity varies widely, but he also warned against the conclusion that hiring solves systemic problems. The SPACE framework (Forsgren et al., 2021) goes further: measuring individual developer "productivity" with a single metric is not just inaccurate, it's counterproductive.
We have data from B2B engineering teams and thousands of hours of tracked coding time. Here's what it actually says about developer performance variance — and why the answer matters less than you think.
{/* truncate */}
The Origin of the 10x Claim
The concept traces back to a 1968 study by Sackman, Erikson, and Grant, which measured programmer performance on coding and debugging tasks. They found a 28:1 ratio between the best and worst performers on debugging time, and a 5:1 ratio on coding time.
Since then, the numbers have been cited, inflated, and mythologized. By the time it reached Silicon Valley folklore, "5-28x" became "10x" — a clean, memorable number that became shorthand for "some developers are dramatically better than others."
But there are problems with applying a 1968 lab study to modern software development:
| Factor | 1968 study | 2026 reality |
|---|---|---|
| Participants | Students with < 2 years experience | Professional developers with 3-20+ years |
| Task type | Small, isolated coding puzzles | Complex systems with dependencies, tests, CI/CD |
| Duration | Hours-long exercises | Multi-month projects |
| Collaboration | Individual | Teams of 3-15 |
| Tools | Text editors, punch cards | IDEs, AI assistants, frameworks, libraries |
| Measurement | Time to complete task + debug | Shipping features, code quality, system reliability |
The original study measured individual coding speed on isolated tasks. Modern software development is a team sport where coding speed is one of many factors.
What Our Data Shows About Developer Variance
Across B2B engineering teams tracked by PanDev Metrics, here's the distribution of daily coding time:
| Percentile | Daily coding time | Label |
|---|---|---|
| P5 | 6 min | Minimal |
| P10 | 18 min | Very low |
| P25 | 38 min | Below average |
| P50 (median) | 78 min | Average |
| P75 | 148 min | Above average |
| P90 | 223 min | High |
| P95 | 261 min | Very high |
| P99 | 279 min | Maximum zone |
The ratio between P90 and P10 is 12.4:1. The ratio between P95 and P25 is 6.9:1. So yes — there is a large variance in raw coding time. You could look at this data and say "10x confirmed."
But you'd be wrong. Here's why.
Why Raw Coding Time Is a Terrible Proxy for "10x"
Problem 1: Role differences
The developer coding 6 minutes per day might be a Staff Engineer who spends their time in architecture reviews, mentoring, and design documents. The developer coding 279 minutes might be a junior implementing CRUD endpoints. Who is more valuable?
| Role | Typical daily coding time | Primary value contribution |
|---|---|---|
| Junior IC | 80-150 min | Feature implementation, learning |
| Mid IC | 60-120 min | Feature implementation, some design |
| Senior IC | 50-100 min | Design, code review, mentoring, implementation |
| Staff+ | 20-60 min | Architecture, cross-team alignment, force multiplication |
| Tech Lead | 30-70 min | Planning, unblocking, implementation |
Coding time decreases as seniority increases, because the developer's value shifts from direct output to multiplying the team's output. Measuring a Staff Engineer by their coding time is like measuring a coach by their personal sprint time.
Problem 2: IDE choice and language inflate differences
Our data shows significant variation in hours per user across IDEs:
| IDE | Users | Total hours | Avg. hours/user |
|---|---|---|---|
| VS Code | 100 | 3,057 | 30.6 |
| IntelliJ IDEA | 26 | 2,229 | 85.7 |
| Cursor | 24 | 1,213 | 50.5 |
IntelliJ users average 2.8x more hours than VS Code users. Is this because IntelliJ users are 2.8x more productive? No. It's because IntelliJ is primarily used for Java (2,107 hours — our top language), which requires more typing, more boilerplate, and more IDE time than TypeScript (1,627 hours) or Python (1,350 hours).
A Python developer who solves a problem in 50 lines and 30 minutes is not less productive than a Java developer who writes 300 lines in 90 minutes for equivalent functionality. The language defines the measurement, not the developer.
Problem 3: The denominator problem
"10x" requires you to define what "1x" is. Is it:
- Lines of code? (Broken, as discussed above)
- Features shipped? (Size and complexity vary enormously)
- Story points? (Subjective, team-calibrated, not comparable across teams)
- Revenue impact? (Most developers can't attribute their work to revenue)
- Bugs prevented? (Immeasurable by definition)
There is no universal unit of developer output, which means "10x" is undefined. It's not a measurement — it's a feeling dressed up as a number.
What the Data Actually Reveals: The 3x Band
When we control for role, language, team size, and project complexity, the variance narrows dramatically. Within a team of similarly-experienced developers working on the same codebase, the typical performance spread looks like this:
| Metric | Bottom quartile | Median | Top quartile | Ratio (top/bottom) |
|---|---|---|---|---|
| Tasks completed per sprint | 3 | 5 | 8 | 2.7x |
| Focus Time per day | 35 min | 72 min | 105 min | 3.0x |
| Planning Accuracy | 0.42 | 0.62 | 0.78 | 1.9x |
| Code review turnaround | 18 hours | 8 hours | 3 hours | 6.0x |
| Consistency (CoV) | 0.55 | 0.30 | 0.15 | 3.7x |
The real spread within comparable teams is roughly 2-3x, not 10x. And much of that 2-3x is explained by environment, not talent:
- The top-quartile developer has fewer meetings
- They work on a less fragile codebase
- Their tasks are better defined
- They have more autonomy over their schedule
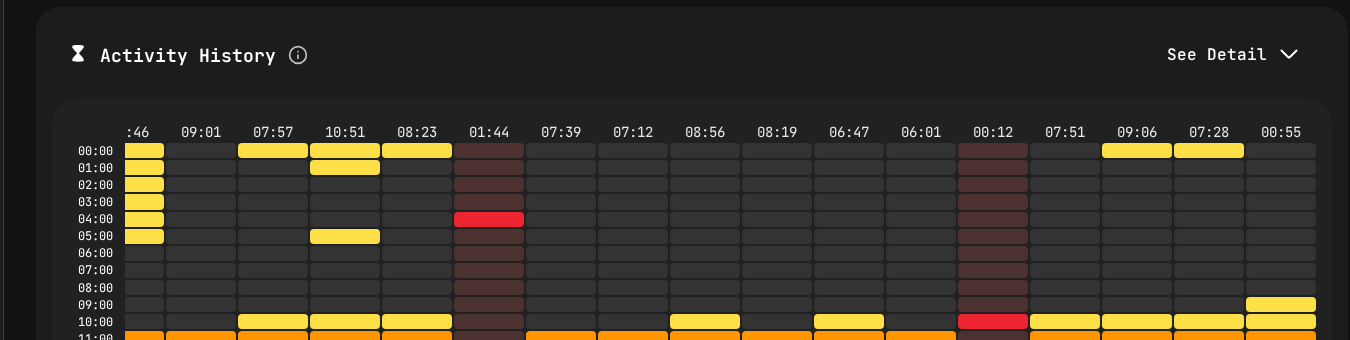 Activity heatmap from PanDev Metrics — the real picture of developer work patterns. Yellow blocks are active coding; gaps are meetings, context switches, and interruptions.
The Five Factors That Actually Create "10x" Gaps
When you do see a 10x gap between two developers on the same team, it's almost always explained by these factors:
1. Meeting load inequality
| Developer | Meetings/day | Available Focus Time | Effective coding |
|---|---|---|---|
| Developer A | 1 | 5+ hours | 120 min |
| Developer B | 5 | 1.5 hours | 20 min |
| Apparent ratio | 6x |
Developer A isn't "6x more talented." They have 6x more opportunity.
2. Codebase familiarity
A developer who's worked on a codebase for 2 years navigates it 3-5x faster than a developer who joined last month. This isn't talent — it's institutional knowledge. It decays when the experienced developer leaves, which is another reason the "10x hire" narrative is dangerous.
3. Task assignment bias
Senior developers often get the cleanest, most well-defined tasks. Junior developers get the ambiguous, cross-cutting, "nobody knows exactly what this should look like" tasks. Then we compare their output and conclude the senior is "10x."
4. Tooling and environment
A developer with a fast CI pipeline, a reliable staging environment, and modern tooling will outproduce a developer fighting Docker configs, flaky tests, and 20-minute build times — regardless of individual skill.
5. AI augmentation gap
With Cursor already at 24 users and 1,213 hours in our dataset, AI-augmented developers are producing code faster than non-augmented ones. This gap will only widen. Is a developer "10x" because they use Copilot and their teammate doesn't? That's a tooling decision, not a talent difference.
Why the 10x Narrative Is Harmful
It justifies underinvestment in teams
"We don't need to fix the process — we just need better developers." This thinking leads to endless recruiting cycles instead of addressing systemic issues that make everyone on the team slower. Gerald Weinberg's Quality Software Management showed decades ago that context switching alone can destroy 20% or more of a developer's productive capacity — a systemic problem no individual hire can overcome.
It creates toxic hero culture
When you celebrate individual "rock stars," you devalue collaboration, code review, documentation, and mentoring — the activities that make the team better but aren't visible in individual metrics.
It distorts compensation
The belief in 10x developers leads to extreme compensation packages for perceived "stars" while undervaluing the solid mid-level developers who actually ship most of the product.
It ignores force multiplication
The most valuable senior developers don't produce 10x the code. They make 10 other developers 20% more productive through good architecture, clear documentation, fast code reviews, and effective mentoring. That's a 2x team multiplier — far more valuable than any individual contributor.
What CTOs Should Measure Instead
If 10x is a myth, what should you actually track?
| Instead of... | Track this... | Why |
|---|---|---|
| Individual coding speed | Team Delivery Index | Team output matters more than individual speed |
| "Rock star" identification | Focus Time distribution | Ensures everyone has the environment to do their best |
| Hero-based planning | Planning Accuracy | Sustainable pace over individual sprints |
| Hours coded | Productivity Score | Composite metric that includes quality and consistency |
| Top performer | Bottleneck detection | Find what's slowing the team, not who's fastest |
PanDev Metrics provides all of these as built-in metrics. The Productivity Score, for example, combines Activity Time, Focus Time, consistency, and delivery metrics into a single score that reflects sustainable performance — not just raw speed.
The Real "10x": Environment Multipliers
If you want 10x improvement, stop trying to hire 10x developers and instead create a 10x environment:
| Multiplier | Potential improvement | How |
|---|---|---|
| Meeting reduction | 1.5-2x | Protect Focus Time blocks, async standups |
| Task decomposition | 1.3-1.5x | Smaller tasks = better estimates = less rework |
| CI/CD speed | 1.2-1.5x | Fast feedback loops reduce context switching |
| Code review SLA | 1.2-1.3x | Unblock developers faster |
| AI tooling | 1.3-2x | Cursor/Copilot for boilerplate, test generation |
| Combined | 3-10x |
A team working in a well-optimized environment with protected Focus Time, fast CI, AI tooling, and small well-defined tasks can absolutely produce 10x the output of a team drowning in meetings, fighting a legacy codebase, and waiting hours for code reviews.
The 10x difference is real. It's just not about the developer — it's about the system.
Based on anonymized, aggregated data from PanDev Metrics Cloud (April 2026), thousands of hours of IDE activity across B2B engineering teams. References: Sackman, Erikson, Grant, "Exploratory Experimental Studies Comparing Online and Offline Programming Performance" (1968); Fred Brooks, "The Mythical Man-Month" (1975); Gerald Weinberg, "Quality Software Management: Systems Thinking" (1992); SPACE framework (Forsgren et al., ACM Queue, 2021).
Want to build a 10x environment instead of hunting for 10x developers? PanDev Metrics shows you where your team's time goes, what's blocking delivery, and how to create conditions for everyone to do their best work.