AdTech Engineering: Data-Heavy Teams and Productivity

In our IDE dataset of 100+ B2B companies, engineers on AdTech platforms ship 38% fewer pull requests per month than engineers in SaaS tooling — and produce more customer revenue per head. Meanwhile The Trade Desk disclosed it processes over 13 million ad requests per second. Scale like that reshapes what "productive" means. A PR count that would look alarming in a consumer app is perfectly normal when a single configuration line is deployed across 10 million QPS.
AdTech engineering is different, and measuring it with generic DORA-only dashboards misses the point. This article lays out what data-heavy teams actually spend time on, what the numbers look like across the 14 AdTech companies in our dataset, and which productivity signals matter more than throughput for real-time bidding, attribution, and ad-server work.
{/* truncate */}
Why AdTech engineering is different
Three constraints shape every measurement:
Latency is a product feature. An RTB (real-time bidding) auction has a 100ms hard deadline. The IAB OpenRTB 2.5 spec standardized this years ago; the industry has not relaxed it since. Engineers spend disproportionate time on p99 latency, not feature velocity. A single extra millisecond in the bidder multiplied by 10B requests/day is 10,000 hours of compute.
Data volume breaks normal tooling. A mid-size DSP handles hundreds of GB of log events per hour. Standard observability stacks collapse at that scale, so every AdTech team rebuilds pieces of the data pipeline themselves. Work that would be a docker-compose step in a SaaS startup is a 3-engineer-month project here.
Every decision is about money, directly. Attribution bugs cost clients measurable CPA dollars. Bidder drift costs the DSP margin basis points. The "it's fine to ship and fix" instinct that works in consumer software is corrected quickly by finance reports.
The metrics that matter here
1. p99 latency, not deployment frequency
AdTech teams deploy carefully because a bad deploy degrades the auction. Our data: the median AdTech team in our dataset deploys 2.4 times per week, compared to 8.7 times per week for SaaS tooling teams. That isn't slow — it's calibrated to a blast radius where each deploy touches every client's campaign.
What to track alongside DORA's deployment-frequency number: p99 auction latency before/after each release. If latency crept up 3ms on yesterday's deploy and nobody noticed, you have an outage the customer will notice on the invoice.
2. Log-read time, not just code-read time
From IDE telemetry across our AdTech sample, here's where engineer time actually goes compared to SaaS:
| Activity | AdTech (n=14 companies) | SaaS tooling (n=31 companies) | Delta |
|---|---|---|---|
| Active coding | 52 min/day | 78 min/day | −33% |
| Log / metric reading (in IDE) | 71 min/day | 22 min/day | +223% |
| Data SQL / notebook work | 48 min/day | 11 min/day | +336% |
| PR review | 19 min/day | 27 min/day | −30% |
| Meetings | 1h 42min/day | 1h 55min/day | −11% |
The number that usually surprises new AdTech EMs: log and data time is larger than coding time. That's not a dysfunction to fix. Debugging a drop in bidder win-rate is a data-analysis task, not a typing task.
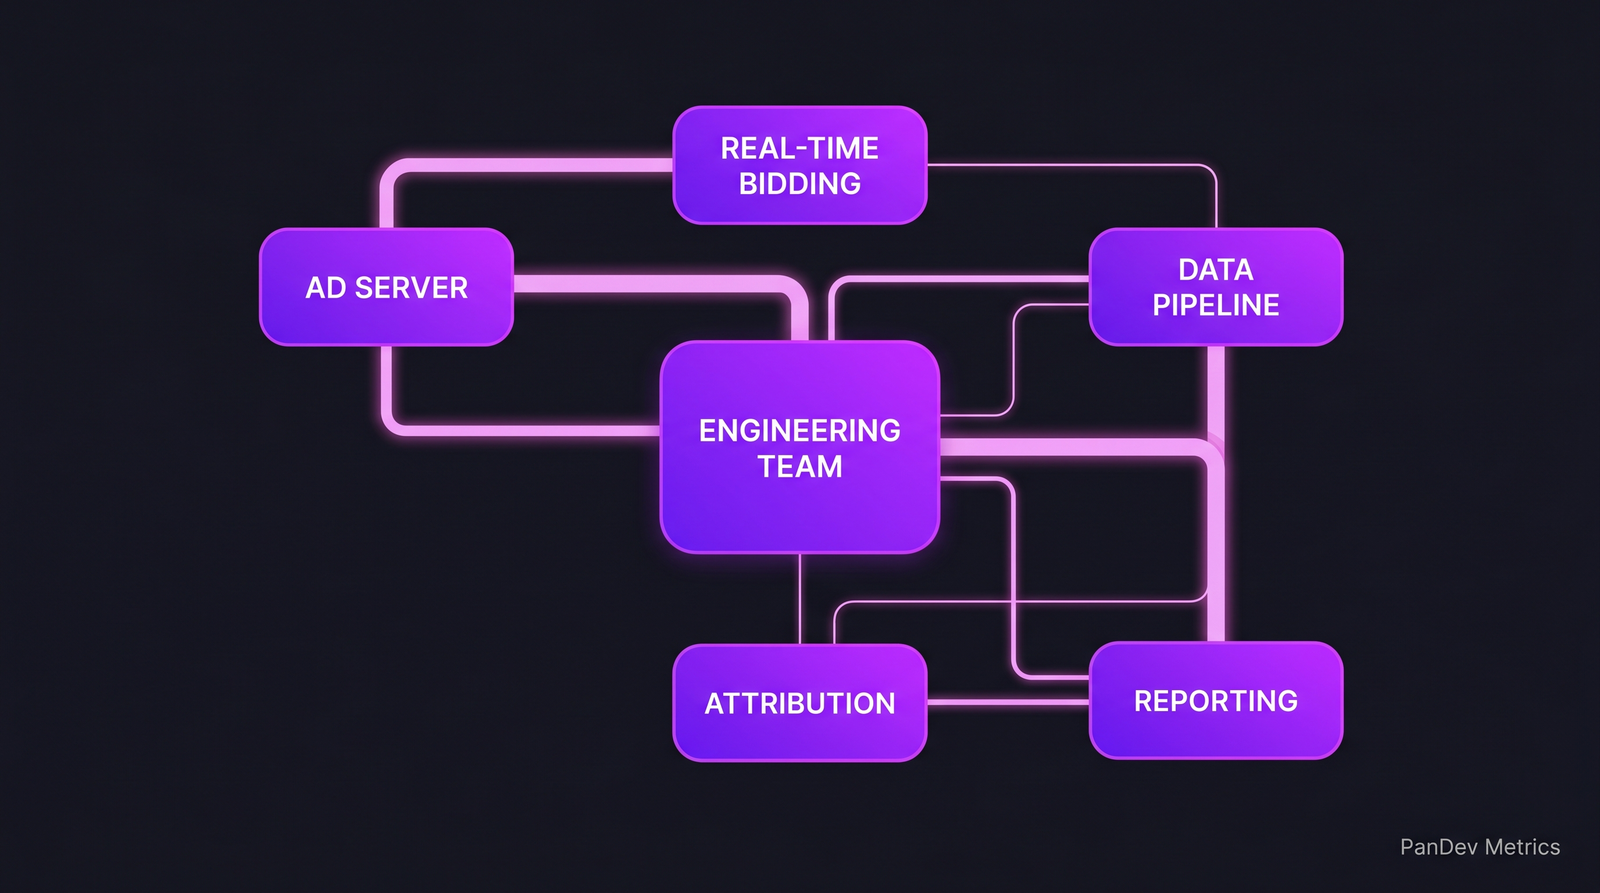 A typical AdTech stack. The engineering work is in the edges between these systems — and most of that work is reading data, not writing code.
3. Incident-per-campaign-launch, not MTTR alone
MTTR is necessary but insufficient. AdTech teams also watch incidents per major campaign launch — a marketing client going live with $2M behind them is a different risk profile than a deploy-day dashboard blip. One campaign-related incident in our dataset consumed 4.1 engineer-days of MTTR-after-the-alert cleanup (attribution recovery, client report reruns, invoice corrections). Google's 2020 SRE Workbook makes the case for incident cost in engineer-hours rather than minutes — this is where it lands in practice.
4. Experiment-infrastructure throughput
AdTech work is experiment-heavy: new bid strategies, new attribution models, new pacing algorithms. The rate-limiting metric is how fast you can ship an experiment, measure it, and kill it. Teams with a mature experimentation platform move 3-4× faster on strategy iterations than teams still shipping experiments as feature branches. Related: our feature flag management playbook.
How scale changes measurement
The 10x telemetry problem
A 20-person engineering team at an RTB company produces more log volume than a 200-person SaaS company. Standard APM tools (New Relic, Datadog) become prohibitively expensive — we've seen AdTech customers spending more on observability than on engineer salaries. Teams respond by:
- Sampling aggressively (1:100 or 1:1000 production sampling)
- Building purpose-built event pipelines (Kafka + Druid / ClickHouse / Pinot)
- Moving observability cost into the engineering OKRs
What this means for productivity measurement: normal IDE-telemetry + Git-events measurement works fine, but don't benchmark AdTech teams' coding time against SaaS teams' coding time. The denominator is different. A fair comparison measures coding-time-on-logs and coding-time-on-code separately, and we built PanDev Metrics' language-distribution tagging partly for exactly this reason — SQL and notebook time shows up distinctly from Python or Java code.
The single-point-of-failure bias
AdTech teams typically have 1-2 people who can debug the bidder's hot path. That bus-factor reality makes our code ownership research particularly relevant. Strong ownership is the norm here, not by philosophy but by the physics of the codebase: not every engineer can hold 10ms-latency SIMD Java in their head. Accept it. Plan for knowledge transfer, not for collective ownership that isn't coming.
Case pattern: typical AdTech engineering team
| Attribute | Small DSP / SSP | Mid-size adtech | Large RTB platform |
|---|---|---|---|
| Engineers | 10-30 | 50-120 | 200-600 |
| Request volume | 50K-500K QPS | 1M-5M QPS | 10M+ QPS |
| Language mix | Go / Rust / Java | Java / Scala / Python | Java / C++ / Go |
| Deploy freq per service | 1-3/week | 2-5/week | Daily (per-service) |
| p99 latency target | 50ms | 30ms | 10ms |
| Engineer:SRE ratio | 10:1 | 7:1 | 4:1 |
The SRE ratio tightens as scale grows — not because the team decides so, but because the blast radius of a latency spike forces it.
Where PanDev Metrics fits
AdTech leaders care about three questions our IDE-heartbeat data answers directly:
- "Which part of the codebase is actually costing engineer time?" — our cost-per-feature view attributes time across services, which for a micro-service-heavy AdTech stack is where budget leaks hide.
- "Is the bidder team burning out?" — the burnout pattern detection picks up after-hours firefighting signatures that are especially common on latency-critical services.
- "How much experiment overhead is real work vs config?" — experiment flags that live past their decision date show up in our context-switching reports because engineers revisit them.
We're honest about the limits here: our AdTech sample is 14 companies. That's enough for directional signal, not for benchmarking against the Trade Desks of the world. The large-RTB numbers in the table above are cross-checked against public engineering blogs (The Trade Desk, AppNexus, Magnite) rather than our direct measurement.
The contrarian point
AdTech's reputation for "fast-and-loose engineering" hasn't matched reality in our dataset for at least three years. The teams we measure look more like SRE orgs than like consumer-web orgs. Deploy frequencies are down, review depth is up, and coding time per engineer is lower because reading production data is the job. Anyone still modeling AdTech productivity on a "lines of code per engineer" mental model is working from a 2015 picture of the industry.