AI/ML Teams: How to Track Research vs Engineering Work

AI/ML teams are unlike any other engineering organization. Half the team is exploring novel approaches where most experiments fail — and that's expected. The other half is building production systems where reliability and speed matter. Many team members do both, switching between Jupyter notebooks and production codebases within the same day. The MLOps maturity model defines this spectrum — from ad hoc experimentation (Level 0) to fully automated ML pipelines (Level 2) — and most organizations sit somewhere in the middle.
Traditional engineering metrics don't capture this duality. Measuring an ML researcher by deployment frequency is like measuring a chef by how fast they wash dishes. But having no metrics at all means you can't tell whether your research investment is producing results or if your production systems are reliable. Papers with Code trend data shows that the gap between state-of-the-art research and production-ready ML is widening — making the research-to-production bridge more critical than ever.
Here's how to build a metrics framework that respects the difference between research and engineering while giving leadership the visibility they need.
{/* truncate */}
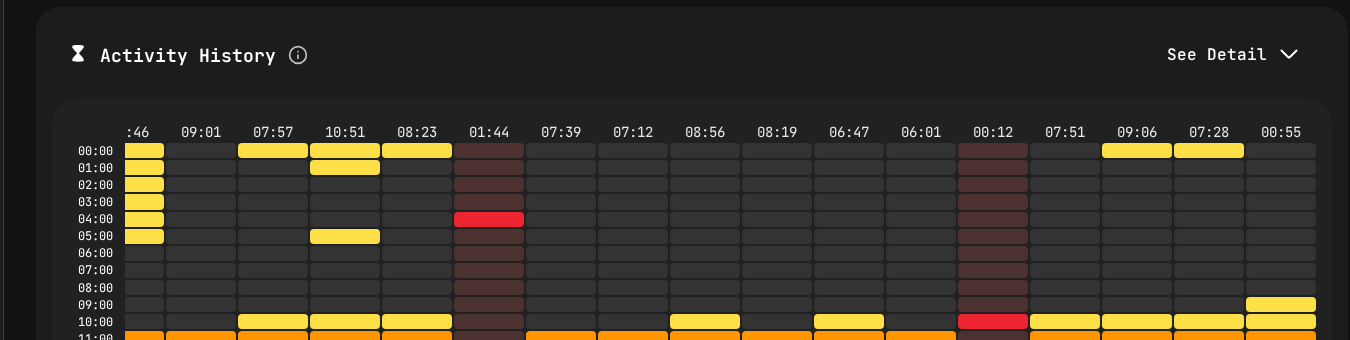
Activity patterns showing different coding rhythms for research vs engineering work.
The Fundamental Problem: Two Modes of Work
AI/ML organizations have two fundamentally different work modes:
Research/Exploration Mode
- Goal: Discover something new — a better model, a novel approach, a performance breakthrough
- Success rate: Low by design. Most experiments fail. That's the point.
- Output: Knowledge, publications, prototypes, proof-of-concepts
- Work pattern: Nonlinear. Long periods of reading, thinking, and experimenting, punctuated by breakthroughs
- Code characteristics: Experimental, often in notebooks, frequently discarded
Production/Engineering Mode
- Goal: Build reliable, scalable systems that deliver AI/ML capabilities to users
- Success rate: High expected. Deployments should work. Pipelines should be reliable.
- Output: Production models, APIs, data pipelines, monitoring systems
- Work pattern: More predictable. Sprint-based or Kanban-style flow
- Code characteristics: Production-quality, tested, documented, maintained
The problem isn't that these modes exist — it's that they're invisible to traditional metrics. A researcher who spent three weeks exploring a dead-end approach before finding a breakthrough looks unproductive in any standard framework. An ML engineer who deploys daily looks efficient, but their models might be mediocre.
Why Standard Metrics Mislead in AI/ML
Deployment Frequency
Standard interpretation: higher is better. Ship more often, get faster feedback.
AI/ML reality: Research doesn't "deploy" in the traditional sense. An ML researcher might push experimental code to a branch, run training jobs, analyze results, and iterate — none of which produces a "deployment." Meanwhile, the ML engineering team might deploy model updates and pipeline changes frequently.
Comparing deployment frequency between these two groups is meaningless.
Lead Time for Changes
Standard interpretation: shorter is better. Reduce the time from idea to production.
AI/ML reality: The "lead time" for a research insight might be months. The researcher reads papers, formulates hypotheses, designs experiments, runs them, analyzes results, and eventually produces a finding that can be productionized. Measuring this as lead time creates absurd numbers.
Lines of Code / Commit Frequency
Standard interpretation: proxy for activity and productivity.
AI/ML reality: A researcher might spend a week reading papers and thinking, then write 50 lines of code that represent a breakthrough. An ML engineer might write 2,000 lines of pipeline code that's necessary but routine. Activity-based metrics wildly misrepresent the value of research work.
A Better Metrics Framework for AI/ML Teams
Separate the Streams
The first step is explicitly categorizing work as research or engineering:
By repository: Research code typically lives in different repositories (or at least different branches/directories) than production code. PanDev Metrics tracks activity by repository, making this separation automatic.
By project: In Jira or ClickUp, maintain separate projects or labels for research and engineering work. PanDev Metrics integrates with both, allowing you to correlate activity with work type.
By team: If your organization has distinct research and engineering teams, team-level metrics naturally provide this separation.
Research Metrics
For research/exploration work, track these metrics:
Experiment Velocity: How many experiments is the research team running? This is the research equivalent of deployment frequency — it measures how quickly the team is generating and testing hypotheses.
Track this through:
- Git activity on research repositories (commits, branches created)
- IDE Activity Time on research projects (captured by PanDev Metrics' heartbeat tracking)
- Training job submissions (if integrated with your ML platform)
Higher experiment velocity is generally better — it means the team is moving quickly through the hypothesis-test-learn cycle.
Research-to-Production Conversion Rate: What percentage of research projects eventually produce something that's deployed to production? This isn't about individual experiments (most should fail), but about research initiatives or themes.
Track this quarterly:
- Number of research initiatives active
- Number that produced production-deployable results
- Time from research finding to production deployment
A healthy conversion rate varies by organization, but tracking the trend matters more than the absolute number.
Knowledge Dissemination: Research that stays in one person's head is wasted investment. Track:
- Internal presentations and documentation produced
- Code shared to common libraries
- Collaboration patterns (are researchers working with engineering teams?)
PanDev Metrics' activity data can show cross-repository collaboration — researchers working in production repos and engineers working in research repos indicate healthy knowledge flow.
Focus Time for Researchers: Research requires deep, uninterrupted thinking. PanDev Metrics' Focus Time metric is especially valuable here. If your ML researchers are averaging less than 3 hours of Focus Time per day, they're being pulled into too many meetings, reviews, or operational tasks.
Research Focus Time should be protected aggressively. Every hour of interrupted research time is dramatically less valuable than an hour of deep research time. This aligns with Cal Newport's Deep Work framework — ML research is perhaps the purest example of work that requires sustained, uninterrupted concentration to produce breakthroughs.
Engineering Metrics
For production/engineering work, standard DORA metrics apply, with AI/ML-specific additions:
Standard DORA:
- Deployment frequency for ML services and pipelines
- Lead time for model updates and pipeline changes
- Change failure rate for model deployments and data pipelines
- MTTR for ML system incidents
ML-Specific Additions:
Model Deployment Lead Time: The time from "model is trained and validated" to "model is serving production traffic." This captures the productionization pipeline efficiency — packaging, testing, staging, canary deployment, full rollout.
Pipeline Reliability: What percentage of data pipeline runs complete successfully? Failed pipeline runs waste compute resources and can delay model updates.
Model Rollback Rate: How often do you need to roll back a model deployment? This is the ML equivalent of change failure rate, but specific to model updates.
Hybrid Metrics (Bridging Research and Engineering)
Handoff Time: When research produces a result ready for productionization, how long does it take the engineering team to pick it up? Long handoff times indicate poor communication or misaligned priorities between research and engineering.
Productionization Effort: How much engineering Activity Time is required to take a research prototype to production? If this is consistently high, either research code quality needs to improve or the production infrastructure needs better tooling for ML workloads.
Retraining Efficiency: Once a model is in production, how much effort does retraining require? Track Activity Time per retraining cycle — decreasing trends indicate improving automation.
The AI/ML Leadership Dashboard
CTO View
Research Health:
- Active research initiatives: [count]
- Experiment velocity: [experiments per week, trend]
- Research Focus Time: [average hours per day, trend]
- Research-to-production pipeline: [initiatives in progress]
Engineering Health:
- DORA metrics for ML services
- Pipeline reliability rate
- Model deployment success rate
- Active production incidents
Investment Balance:
- Engineering Activity Time split: research vs. production engineering vs. operations
- Cost allocation: research compute + personnel vs. engineering
- Conversion funnel: research initiatives → prototypes → production models
Research Lead View
Team Activity:
- Experiment velocity by researcher/sub-team
- Focus Time distribution
- Collaboration patterns (cross-team activity)
- Repository activity trends
Research Pipeline:
- Active experiments and their status
- Promising results ready for deeper investigation
- Results ready for engineering handoff
Engineering Lead View
DORA Metrics:
- Standard deployment frequency, lead time, change failure rate, MTTR
- Broken down by service (model serving, data pipelines, APIs, infrastructure)
ML-Specific:
- Model deployment pipeline health
- Pipeline reliability trends
- Productionization backlog (research handoffs waiting for engineering)
Practical Implementation
Step 1: Repository Structure
Organize repositories to enable metric separation:
- Research repositories (experiments, notebooks, prototypes)
- Production repositories (services, pipelines, infrastructure)
- Shared repositories (common libraries, utilities)
PanDev Metrics tracks activity per repository, so this structure automatically separates research and engineering metrics.
Step 2: Connect Your Stack
Connect PanDev Metrics to your development infrastructure:
- Git platforms: GitLab, GitHub, Bitbucket, or Azure DevOps
- IDE plugins: Support for JupyterLab and VS Code (common in ML), plus JetBrains IDEs (PyCharm is popular for ML engineering)
- Project tracking: Jira or ClickUp for correlating metrics with planned work
Step 3: Establish Baselines
Collect 4-6 weeks of data across both research and engineering teams. Understand:
- What's the current experiment velocity?
- How much Focus Time do researchers actually get?
- What are the engineering DORA metrics baselines?
- How is Activity Time distributed between research and engineering?
Step 4: Calibrate Expectations
This is critical. Share baseline data with both research and engineering teams and calibrate:
- What experiment velocity is healthy for your research goals?
- What Focus Time target should you protect for researchers?
- What DORA targets are appropriate for your ML services?
- How should the research-engineering Activity Time split look given your strategic priorities?
Step 5: Monitor and Adjust
Weekly review cadence:
- Research team reviews experiment velocity and Focus Time
- Engineering team reviews DORA and ML-specific metrics
- Combined review of handoff time and productionization pipeline
Monthly review:
- Research-to-production conversion rate
- Activity Time distribution trends
- Financial analysis of research vs. engineering investment
Common Anti-Patterns
Treating Researchers Like Engineers
If you measure researchers by deployment frequency and lead time, they will optimize for those metrics — running shallow experiments that can be "deployed" quickly rather than pursuing deep, potentially breakthrough research. You'll get more deploys and less innovation.
Treating Engineers Like Researchers
If you don't track DORA metrics for your production ML team because "AI is different," you'll end up with unreliable services, slow deployments, and poor incident response. Production ML systems need the same engineering discipline as any other production system.
Ignoring the Research-to-Production Gap
Many AI/ML organizations have a "valley of death" between research and production. Researchers produce promising results that never get deployed because:
- Engineering team is too busy with maintenance
- Research prototypes are too far from production-quality
- No one owns the handoff process
Track handoff time and productionization effort to make this gap visible and actionable.
Over-Optimizing Research Metrics
Experiment velocity is valuable, but "number of experiments" can be gamed. A team running 50 trivial hyperparameter variations is less valuable than a team running 5 carefully designed experiments that test genuinely different approaches.
Combine experiment velocity with conversion rate — lots of experiments that never produce useful results suggest the research direction, not the research pace, needs attention.
Protecting Research While Maintaining Accountability
The core tension in AI/ML metrics is maintaining research freedom while ensuring accountability for research investment. Engineering metrics navigate this by:
- Measuring activity, not outcomes, for individual researchers: Focus Time and experiment velocity show engagement without judging research direction
- Measuring outcomes at the portfolio level: Research-to-production conversion rate evaluates the research program, not individual researchers
- Making the investment visible: Activity distribution and financial analytics show leadership exactly how research investment is allocated
- Protecting deep work: Focus Time metrics justify protecting researchers from meetings and interruptions
This balance ensures that researchers have the freedom to explore while the organization has the visibility to ensure research investment is managed responsibly.
Leading an AI/ML team? PanDev Metrics — engineering intelligence that understands the difference between research and production, with IDE tracking across JupyterLab, VS Code, and 10+ development environments.