Best Jellyfish Alternative in 2026: 5 Tools Compared

Jellyfish is good at what it was built for: portfolio-level visibility for VPs of Engineering at 200+ developer organizations. It surfaces "what percentage of engineering effort goes to growth vs. maintenance" in a board-deck-ready format. That's a real problem at real scale, and Jellyfish solves it.
The friction is the price tag and the fit. Public references and customer reports place Jellyfish contracts in the $50K-$250K/year range, with most deals near or above $100K. For a 60-engineer company that wanted "DORA + a bit of resource allocation", that's the wrong shape and the wrong invoice.
If you're searching "Jellyfish alternative" you're usually in one of two camps. Either you piloted Jellyfish and the price didn't survive procurement, or you're at 30-150 engineers and the platform is overbuilt for your actual question. Both are common. Here's the honest landscape in 2026.
{/* truncate */}
When teams outgrow (or never fit) Jellyfish
Jellyfish was built around one core thesis: engineering at scale is a portfolio allocation problem. That thesis assumes a few things about your org:
- You have 200+ developers across 15+ teams
- You report engineering investment to a board or finance org quarterly
- You already run Jira maturely (epics, initiatives, custom fields), since Jellyfish reads from it
- You have someone whose job includes "is engineering investment matching strategy"
The 2024 Stack Overflow Developer Survey reported that 56% of professional developers work in companies with under 100 engineers. For most of those teams, "portfolio investment view" is the wrong question. The right questions are "where does our cycle time leak", "are we shipping faster than last quarter", "who's burning out". Jellyfish answers those, but you're paying for a portfolio engine you don't run.
The other failure mode: your company is large enough but your data isn't. Jellyfish derives investment categories from Jira metadata. If your Jira hygiene is shaky (and DORA's 2024 State of DevOps Report flagged tracker hygiene as a top-3 friction across 1,300+ surveyed teams), the dashboard reflects messy input.
The 5 alternatives that actually compete
Not every "engineering analytics" tool replaces Jellyfish. We're ranking by fit for teams who explicitly evaluated Jellyfish and chose differently, not by general market share.
| Alternative | Best fit | Annual cost (typical 50 devs) | On-prem | IDE telemetry |
|---|---|---|---|---|
| PanDev Metrics | Mid-market needing IDE + DORA + cost in one | ~$15K-$25K | Yes (Docker/K8s) | Yes |
| LinearB | DORA-focused teams wanting workflow automation | ~$30K-$60K | No | No |
| Swarmia | Eng-led teams wanting opinionated workflow | ~$25K-$45K | No | No |
| Faros AI | Enterprises wanting a data warehouse approach | ~$80K-$150K | Yes | Partial |
| Plandek | UK/EU teams wanting flow metrics with consulting | ~$40K-$80K | Yes | No |
The Jellyfish replacement decision usually comes down to one axis: do you need strategic portfolio depth (in which case the only true peer is Faros AI at similar price), or do you actually need operational engineering intelligence (in which case any of the others wins on cost and time-to-value).
Five evaluation criteria that matter
Most "alternative to Jellyfish" comparisons read as feature checklists. Feature checklists are how vendors win RFPs and how buyers regret purchases 12 months later. Here are the criteria that predict satisfaction at the 12-month mark, based on customer interviews we've run during our own sales cycles.
1. Time to first useful dashboard
Jellyfish's reported onboarding window is 6-12 weeks because Jira mapping requires consulting hours. If your replacement also needs 8 weeks of mapping, you didn't escape the problem.
PanDev Metrics has a documented 15-minute GitLab setup and similar GitHub flow. LinearB and Swarmia clock in around 1-2 weeks. Faros AI is closer to Jellyfish in onboarding length. Time-to-value is a real cost line nobody puts on the procurement slide.
2. What "developer activity" actually means
This is where most alternatives quietly diverge. Jellyfish, LinearB, Swarmia, Plandek all derive activity from Git events and ticket changes. That's PR-level visibility, not coding-level visibility.
Microsoft Research's 2020 paper "What Predicts Software Developers' Productivity?" (Forsgren, Storey, Maddila et al.) found that self-reported satisfaction correlates poorly with PR-event metrics alone. The signal that mattered was uninterrupted coding time, which only IDE-level telemetry captures. WakaTime had this insight early but never built the team-management layer around it. PanDev Metrics is the only Jellyfish-class platform that ingests IDE heartbeat data alongside Git and tracker events. That's why our research on coding time shows 1h 18m median active coding while PR-event tools report numbers 3-5x higher.
The contrarian claim: PR cycle time charts make engineering look healthier than it is, because you only count work that became a PR. Half of senior engineers' weeks doesn't.
3. Cost-per-feature without consulting
Jellyfish's allocation view answers "how much engineering investment did Initiative X consume". Useful, but it requires Jira maturity to be honest. PanDev Metrics computes cost per feature directly from tracked coding time × hourly rate, with no allocation framework and no consulting engagement. Faros AI gets there too but you wire the data warehouse yourself.
If your CFO asked "what did Feature X cost us" once, ignore. If they ask quarterly, this becomes the load-bearing column in your evaluation.
4. On-prem and air-gapped support
Jellyfish is cloud-only. For fintech, govtech, telecom, and any team subject to data-residency rules, that's a hard stop. Faros AI offers self-hosted with significant lift. PanDev Metrics ships a Docker Compose and a Helm chart: same product, on-prem or cloud. Plandek can self-host but with consulting overhead.
A telecom client of ours runs PanDev Metrics fully air-gapped behind their corporate firewall. That deployment took 2 days. The same posture would not have been viable on Jellyfish at any price.
5. The "what would we lose" question
This is the criterion most buyers skip and most regret. Be honest: if you replace Jellyfish, what specific question goes unanswered?
For most teams under 200 engineers, the answer is "nothing we currently look at weekly". For teams above 500 engineers running formal portfolio reviews, the answer is real. PanDev Metrics doesn't pretend to have Jellyfish-grade strategic-initiative-mapping. We track delivery index, DORA, cost-per-feature, IDE activity, and burnout signals: that's the bottom-up picture. The top-down portfolio narrative still requires Jellyfish or Faros AI, or a custom Looker layer on top of one of us.
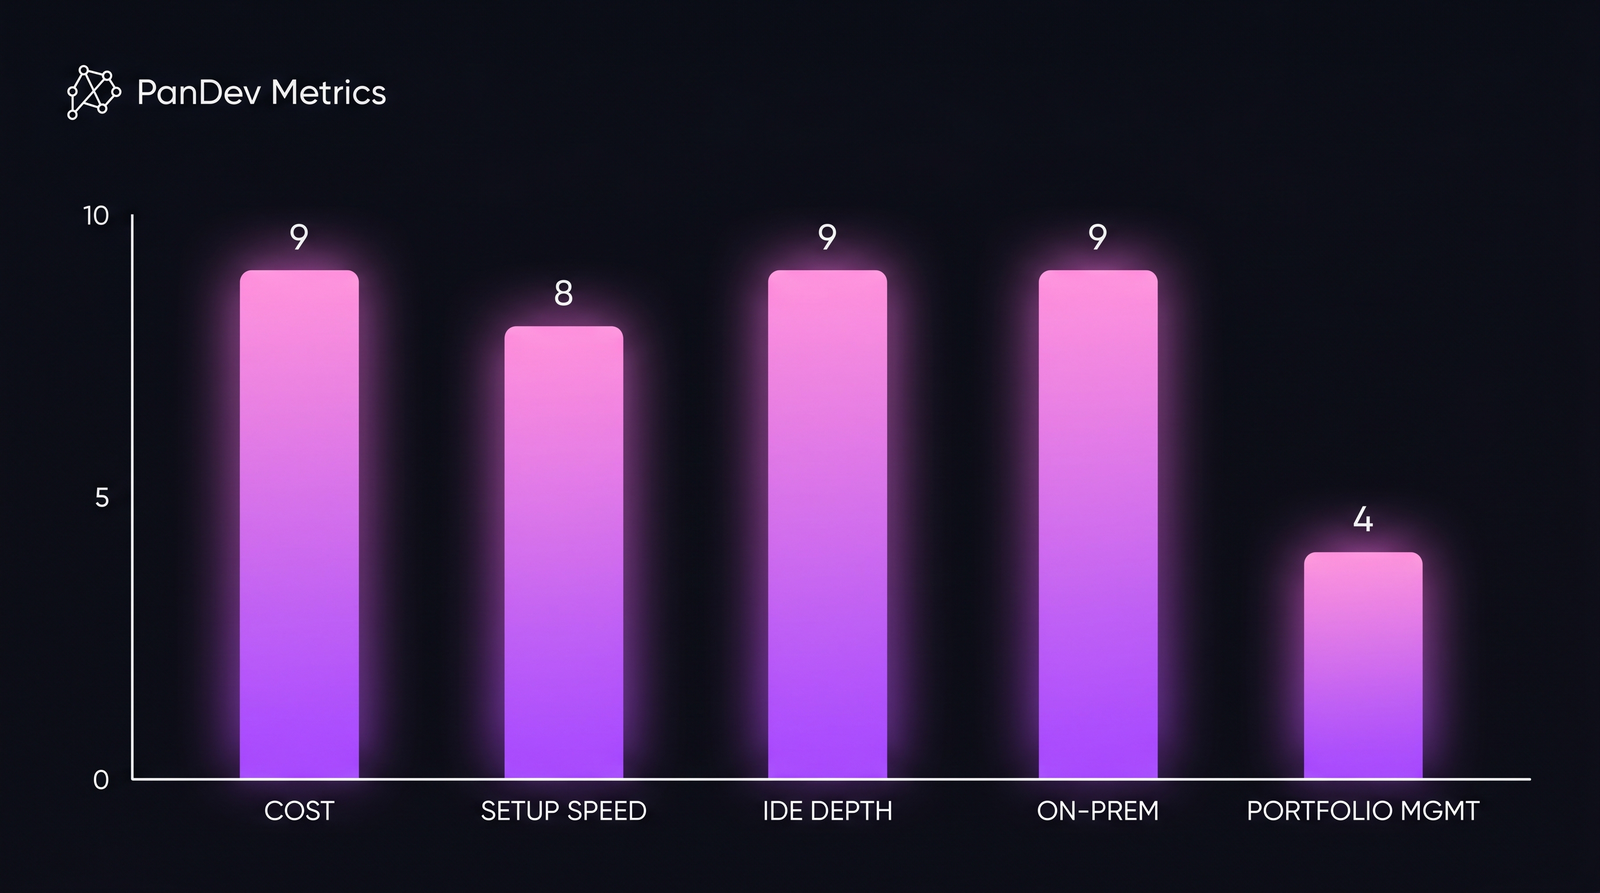 Relative fit scores (1-10) across five evaluation axes for mid-market teams (50-200 engineers). Higher = stronger fit. Strategic portfolio depth is the one axis where Jellyfish remains uncontested, but most evaluators don't actually need it.
Pricing reality (the part procurement cares about)
| Plan tier | Jellyfish (reported) | PanDev Metrics | LinearB | Swarmia |
|---|---|---|---|---|
| Entry (10-25 devs) | Not offered | $15-25/dev/mo | $25-30/dev/mo | $20-35/dev/mo |
| Mid (50-150 devs) | $80K-$150K/yr | $20-30/dev/mo | $30-40/dev/mo | $25-40/dev/mo |
| Enterprise (200+) | $150K-$250K+/yr | Custom | Custom | Custom |
| Min seats | ~50 | 5 | 25 | 25 |
| Setup fee | Often required | None | None | None |
Two things to read off this table. First: Jellyfish doesn't have an entry tier; they don't sell to teams under 25 engineers, period. Second: the per-seat math at 50 devs is roughly 4-7x for Jellyfish vs. PanDev. That gap is what funds your CFO's "yes" on a different tool.
Honest limits
We are PanDev Metrics. This article is biased toward the "operational engineering intelligence" framing because that's what we do. We do not do strategic portfolio management at Jellyfish's depth. Our IDE dataset comes from B2B companies in mostly KZ, UZ, RU, and select EU/SG/US deployments. Solo developers and pure open-source contributors are not in the dataset, so behavior patterns there may differ.
If your honest answer to "what would we lose" includes board-level investment-allocation reporting against named strategic initiatives, Jellyfish or Faros AI is the right tool. Don't replace it just because procurement winced.
The decision in one paragraph
If you're a 30-150 engineer team and Jellyfish is overbuilt: PanDev Metrics replaces it on cost and adds IDE-level signal, with on-prem if you need it. If you're 200+ and want portfolio depth at a lower price than Jellyfish, look at Faros AI. If you specifically want DORA-only with workflow automation, LinearB. If your team culture leans toward opinionated workflow guidance, Swarmia. If you're in the UK with a consulting preference, Plandek.
The wrong answer is to assume every Jellyfish alternative does the same thing. They don't, and the gap between them is wider than the gap between any of them and Jellyfish on the dimensions you'll actually use.