Best Swarmia Alternative in 2026: When Git-Only Analytics Hits a Wall

Swarmia is the cleanest Git-driven engineering analytics tool you can buy. It pulls commits, PRs and deployments, computes DORA, surfaces team-level cycle time, and stays out of your way. Most teams that buy it stay happy for a year or two. Then a question arrives that the tool was never designed to answer (usually one about money, on-prem, or what coding actually looks like outside the PR), and the search begins.
If you're typing "swarmia alternative" in 2026, this is the question we'll work through.
{/* truncate */}
Where Swarmia is genuinely strong
Three things Swarmia ships better than almost any competitor:
- DORA metrics from Git, computed correctly. Most tools fudge change failure rate. Swarmia ties it to revert / hotfix patterns and gets it right. The 2024 DORA State of DevOps framework is implemented closely.
- PR-cycle metrics with action signals. Not just "your review time is 2 days". Swarmia tells you which PRs are stuck, on whom, and why.
- Team-first, not org-first design. A 30-person engineering org can self-serve dashboards in a week, no admin overhead.
If you're running a Git-disciplined team that already has good PR hygiene, Swarmia is in the top three tools on the planet for that job. The honest framing for the rest of this article: Swarmia is great at what it chose to do. The alternatives matter when you need things it chose not to do.
When teams outgrow Swarmia
We collected migration reasons from teams that switched off Swarmia in the last 18 months. Three patterns dominate.
| Migration reason | What Swarmia doesn't do | Frequency in our pipeline |
|---|---|---|
| "We need to know what a feature costs" | No hourly rate × time math, no cost-per-feature | ~40% |
| "We need on-prem" | Cloud-only (US data residency) | ~30% |
| "Git data isn't the full picture" | No IDE telemetry, no task-tracker time | ~25% |
| "Price became a problem at scale" | Per-seat pricing scales linearly | ~5% |
The IDE blind spot is the one most teams underestimate. Microsoft Research's 2023 work on developer effort showed that only 30-40% of a developer's day ends up in Git artifacts. The rest is reading code, running tests locally, debugging, working on documentation, or thinking. A Git-only analytics tool sees the 30-40% and infers the rest. That's fine for delivery metrics. It breaks down the moment you ask cost or wellbeing questions.
The four real Swarmia alternatives in 2026
Each tool is the right answer to a different question.
| Tool | Best for | Price (2026, list) | Adds vs Swarmia |
|---|---|---|---|
| LinearB | PR workflow automation | $30-50/seat/month | gitStream rules, slack-bots, custom workflows |
| Jellyfish | Engineering ↔ business alignment | $50-100K/year, 50+ seats | Investment categorization, board-ready exec views |
| DX (getdx.com) | DevEx surveys + telemetry blend | $10-20/seat/month | Survey infrastructure for SPACE/DevEx |
| PanDev Metrics | IDE + Git + tasks + cost + on-prem | $15/seat/month | IDE telemetry, cost analytics, Docker/K8s deployment |
Numbers are 2026 list quotes from public pricing pages and reseller conversations. Enterprise tiers vary. Some vendors stopped publishing list prices in late 2025; those rows are based on quotes from migrated customers.
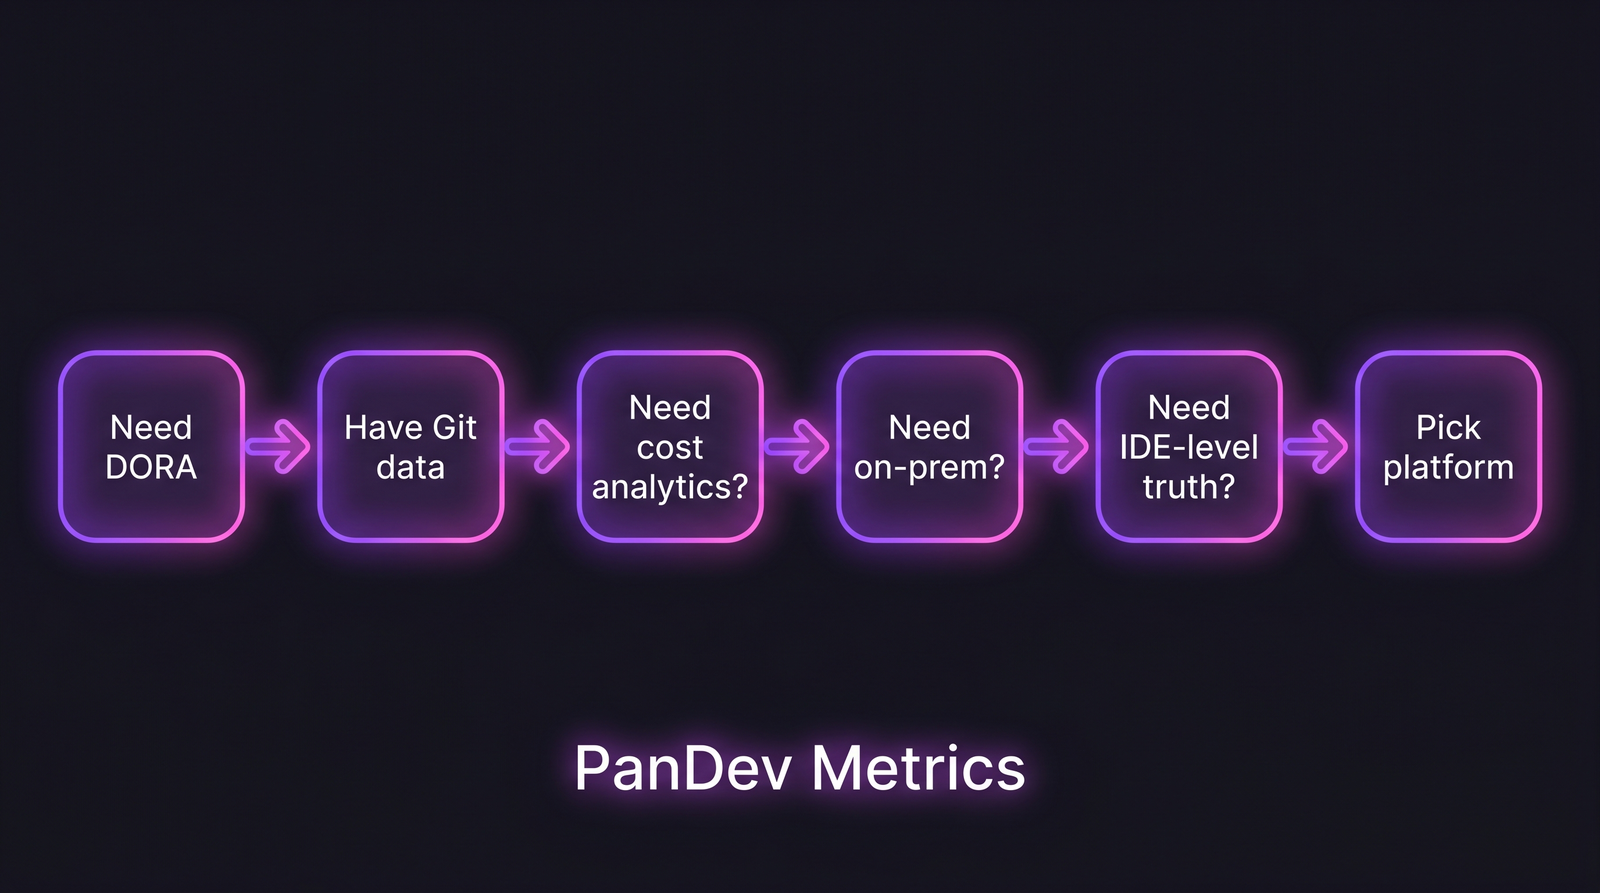 Pick by what's missing. Swarmia's blind spots are cost, IDE-level activity, and on-prem; each maps to a different alternative.
LinearB: when the bottleneck is workflow, not visibility
LinearB takes the same Git data Swarmia ingests and adds a workflow engine on top. gitStream automations enforce rules ("PRs over 400 LoC require two reviewers"), slack-bots ping reviewers, custom dashboards roll up by initiative. If your real complaint about Swarmia is "we have the data and we still can't get PRs merged," LinearB is the upgrade. The price reflects the philosophy: LinearB sells outcomes, not dashboards. We covered the head-to-head in our PanDev vs LinearB comparison.
Jellyfish: for the CFO conversation
Jellyfish lives at the high end. It is built to answer "where did engineering hours go this quarter against our roadmap?" at a level that survives a board meeting. It maps Jira epics to investment categories (new product / KTLO / tech debt / customer-specific) and produces capitalization-ready reports. The minimum buy is meaningful, typically 50+ seats and $50-100K/year.
We have a longer take on when this makes sense in PanDev Metrics vs Jellyfish. Short version: Jellyfish wins for orgs over ~150 engineers where finance wants the engineering view in their language. Below that, the price is hard to defend.
DX (getdx.com): the survey-first alternative
DX takes a different stance: developer experience cannot be inferred from artifacts alone, so they instrument both: telemetry plus quarterly surveys. SPACE / DevEx framework natively. If your CTO has read the DevEx paper and is allergic to "Git-only" analytics, DX is the more philosophically aligned tool. The trade-off is survey participation: it works only if engineers actually fill them out, which past 200 engineers tends to drop below 60%.
PanDev Metrics: for when Git is half the picture
Where we fit: same DORA metrics Swarmia computes, plus IDE heartbeat data from VS Code / JetBrains / Eclipse / Xcode / Visual Studio plugins, plus task-tracker integration (Jira / ClickUp / Yandex Tracker), plus a financial layer that turns hours into cost-per-feature. The four data sources land in one PostgreSQL schema, which is what enables questions like "this Q2 feature took 412 dev-hours across 3 teams, costing $94,800". The query joins Git artifact, Jira ticket, IDE time and hourly rate in a single SQL.
We are also the only tool in this category with a working on-prem Docker and Kubernetes package, a hard requirement in fintech, telecom and govtech, which the cloud-only competitors quietly disqualify themselves from. Forbes Kazakhstan featured us in 2026 partly because that on-prem niche turned out to be larger than the cloud-native incumbents assumed.
What to actually evaluate next
Spec-sheet shopping is the wrong frame. Build a question list first.
Use this evaluation matrix. Score each tool 0-3 against your top-five questions, not against the vendor's feature checklist.
| Evaluation criterion | Weight in 2026 procurement (our observation) |
|---|---|
| Can it answer the questions you can't answer today? | High |
| Does it ingest the data sources you actually have? | High |
| Will it survive a regulator / SOC2 audit? | High in regulated industries, low elsewhere |
| Does the price scale linearly with seats or step-function with tier? | Medium (surprises here cause renewal churn) |
| Does it work with your existing IDE / Git / tracker stack? | Medium |
| Does the vendor have a roadmap aligned with your industry? | Low to medium |
Two questions we actively recommend asking every vendor:
- "What can your tool not measure that I might want to?" A vendor who can't answer this in 60 seconds doesn't know their own product. Run.
- "What's the hardest customer-facing limit you've hit in the last year?" Filter for honesty. If the answer is "none," they don't have customers at scale yet.
The honest limit
The "Swarmia alternative" search tends to be done by an engineering manager who already has Git access and knows the basics. We've assumed that. If you're a CFO landing here without that context, this article isn't pitched to you. Start with DORA metrics: the complete guide for engineering leaders instead.
Also: our customer dataset skews B2B mid-market (10-200 engineers). For 1,000+ engineer orgs, Jellyfish and Faros AI deserve more weight than we gave them here. We've been transparent about this in past comparisons and we'll keep being so. There is no single best tool.
The contrarian read
The default advice in this category is "pick the platform that matches your maturity." That's mostly true. The exception worth naming: most teams pick a platform based on the dashboards in the demo, then use about 20% of the features. We saw it with Swarmia migrations. We saw it with LinearB migrations. The cheapest path to engineering analytics in 2026 is to start with the smallest tool that answers your top three questions, and only upgrade when the questions actually grow. Buying ahead of need is how engineering analytics budgets balloon.
Pick the alternative that makes the next twelve months cheaper to run, not the one that makes the strongest demo.