Bottom-up Engineering Budget: From Rate to Annual P&L

A 50-engineer R&D org we worked with last fiscal year set its annual budget the way most do: take last year's spend ($5.4M), add 10%, call it $5.94M. By Q3, finance was negotiating a $700K supplemental from the board. The shortfall was almost exactly $710K, 12% above the top-down number, and the postmortem traced every dollar to assumptions nobody had written down. Holiday months ran hotter on overhead. Two contractors were on-paper part-time but billed 0.9 FTE. One team grew by three heads in March, and the cost compounded for nine months instead of the four the planner had pencilled.
Gartner's 2025 IT Spending Forecast puts software R&D growth at 9-11% YoY, but the variance band on individual company budgets is much wider. Deloitte's CFO Insights: Budgeting in Volatile Times (2024) found median forecast error of 18% in software-heavy organizations using top-down methods, and the worst quartile missed by more than 30%. McKinsey's 2023 Tech Talent Tectonics report sharpens the case: top-quartile engineering organizations don't just spend less per output. They forecast more accurately, which lets them allocate aggressively where bottom-quartile organizations have to keep cash slack as a hedge against their own bad math.
{/* truncate */}
Why top-down budgets miss
The familiar approach is "we spent $X last year, add inflation and growth, that's the new number." It works for offices and electricity. It fails for engineering for three reasons that compound.
Headcount changes don't smooth. A team that grew 10% in headcount didn't grow 10% in cost. It grew somewhere between 12% and 18%, depending on when the hires landed and at what loaded rate. Top-down treats headcount as an annualized input. Reality: an engineer hired in March costs nine months of salary plus a one-time onboarding cost, while one hired in October costs three months and gets bundled into "next year" by accident.
Utilization is assumed at 100%. Almost every top-down budget implicitly models each engineer as 12 months × 160 hours. Real utilization in B2B engineering organizations runs 70-85% of paid hours when you account for vacation, sick time, parental leave, and the four to six weeks per year that get absorbed by interviewing, onboarding new hires, and quarterly planning. We covered the measurement side in FTE Utilization vs. Hours: The Honest Productivity Metric. Headline finding: even high-discipline teams rarely cross 0.85 FTE on a calendar-year basis.
Overhead K is not constant. The single number "30% overhead" papered onto every team in the budget hides month-to-month swings of 0.30 to 0.55, driven by holiday clusters, vacation gaps, and admin-salary spread over fewer billable hours. We documented this in Overhead Coefficient: The Hidden Tax Per Developer. When the budget plans on K = 0.30 and the org actually runs at K = 0.37, that's a 23% miss on a third of total cost, and it shows up in Q3 every single time.
The fix is not to add more buffer to the top-down number. The fix is to build the budget the way the cost is actually generated: per engineer, per month, with the real utilization and the real overhead. That's bottom-up.
The bottom-up build-up
Bottom-up has six stages. Each one stacks on top of the previous, and the math is boringly mechanical, which is the point. A boringly mechanical budget is one that survives questions from a skeptical CFO.
Rate (loaded $/hr or $/mo)
  × Utilization (FTE 0.0–1.0)
  × Working hours/year (after holidays)
= Annual cost per engineer

Sum across team → Team annual direct cost
Sum across teams → Org annual direct cost
  × (1 + K)        → Org annual loaded cost
  + Hiring reserves → Org annual operational budget
  + Tools / infra   → Final R&D budget
The first stage, loaded rate, is the foundation. We covered it in Loaded Hourly Rate: Why Your Engineer Costs 50% More Than Their Salary. Skip ahead with a vague salary-times-1.3 estimate and the entire bottom-up stack inherits the error. The whole approach is only as accurate as the rate input at the bottom.
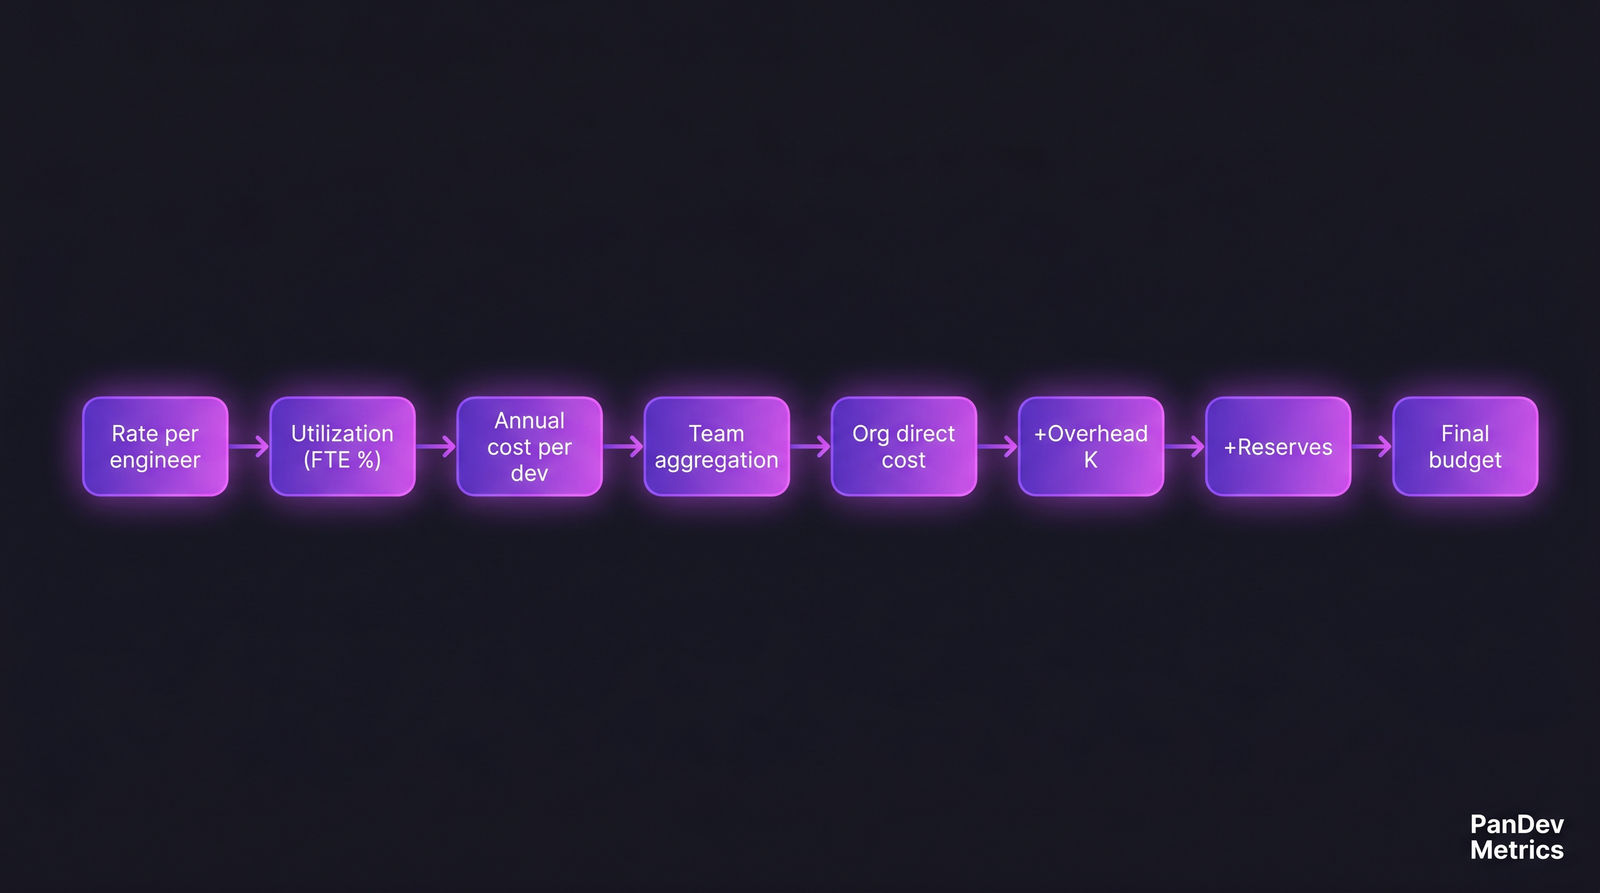 The build-up. Each stage is mechanical; assumptions live in the inputs, not the math.
Stage 1: rate × utilization × hours per role
Here is the per-role build-up for a 50-engineer organization with four functions, expressed as annual cost per engineer:
| Role | Loaded rate | Utilization (FTE) | Productive hours/yr | Annual cost per engineer |
|---|---|---|---|---|
| Backend engineer | $7,500/mo | 0.82 | 1,574 | $73,800 |
| Frontend engineer | $6,800/mo | 0.80 | 1,536 | $65,280 |
| QA engineer | $5,500/mo | 0.78 | 1,498 | $51,480 |
| Platform / DevOps | $9,000/mo | 0.85 | 1,632 | $91,800 |
| Engineering manager | $11,000/mo | 0.70 (75% admin) | 1,344 | $92,400 |
The utilization numbers come from telemetry. PanDev Metrics' POST /departments/{id}/finance/employees endpoint returns annual cost per engineer with utilization already applied. It pulls heartbeat data from the IDE plugins, computes coding hours per month, divides by paid hours, and produces an FTE figure that does not depend on anyone's self-report. For roles where coding is not the primary output (managers, principal engineers spending a third of their week in design review), we override with role-defined utilization rather than measured coding time. The rule: measured for builders, declared for managers, never assumed at 100%.
Multiply rate by utilization by working hours and you get the per-role line. The org from the worked example spends $4.50M of direct labor cost per year: 20 backend at $73.8K = $1.476M, 15 frontend at $65.28K = $0.979M, 10 QA at $51.48K = $0.515M, 5 platform at $91.8K = $0.459M, 5 EMs at $92.4K = $0.462M. Round to $4.5M for the budget rollup; reconcile in the variance review.
Stage 2: aggregate to team, then to org
The team-level rollup is sum of per-engineer cost. The org-level rollup is sum of teams. There is no math here, just structure. The structure is what matters.
POST /finance/summary returns a 30-day org cost figure with per-department split. Run that on the prior fiscal year monthly and you get 12 data points per department per year, a rolling baseline you can use to validate the bottom-up build. If the per-engineer × utilization math says backend should cost $1.476M annually but /finance/summary rolled up shows it actually ran at $1.612M, the gap is evidence that either the loaded rate is too low or the utilization assumption is too generous. Treat the gap as a calibration loop, not as a contradiction.
The Year Dropdown on /dashboard/finances is the practical UI for this. It lets you replay any prior fiscal year's monthly cost shape and overlay the bottom-up forecast against it before the budget gets locked. We learned the hard way that without this validation step, the bottom-up number is just a more elaborate guess.
Stage 3: apply per-month K, not flat K
Apply the overhead coefficient month by month, not as one annual number. K swings from 0.30 in February steady-state to 0.55 in July and August when vacation thins out the productive denominator while admin salary keeps running flat. A flat K = 0.37 over the year would over-cost February and under-cost August, averaging out only if the calendar shape is identical year over year, which it usually isn't.
For the worked org, the direct labor of $4.50M × annual-weighted K of 0.37 produces overhead of $1.665M, rounding to $1.65M. The overhead line in the budget is a single number for board reporting, but the build behind it is twelve. The variance review at the end of each quarter compares planned-K-by-month to actual-K-by-month. That is the comparison that catches a 12% overrun by week six instead of week thirty-six.
Stage 4: reserves and tools
Two line items top-down budgets routinely fold into overhead and then forget:
Hiring reserves. If the plan is to add five engineers across the year, the cost is not five × annual-rate. It is partial-year salary per hire (depending on start month) plus one-time recruitment cost: agency fee, sign-on bonus, relocation, equipment, seats, security review. Deloitte's CFO benchmarking rule of thumb: $15-25K one-time per hire, plus 30-50% of annual loaded cost for partial-year salary. For five planned hires staggered across the year, $300K is a defensible reserve.
Tools and infrastructure. AWS / GCP, GitHub seats, Jira, observability, IDE licenses, AI coding assistants, security scanners. For a 50-engineer org, $200K/year is conservative; $400K/year is normal at scale. Keep it separate because it grows with headcount at a different slope: some tools are per-seat, some per-environment, some flat fees that step at thresholds.
The two budgets, side by side
Same 50-engineer organization. Same fiscal year. Two methods. Different numbers.
| Line item | Top-down ($5.4M + 10%) | Bottom-up | Where the gap hides |
|---|---|---|---|
| Direct labor | $4.20M | $4.50M | Real loaded rates, real per-role utilization |
| Overhead | $1.26M (flat 30%) | $1.65M (K = 0.37, monthly) | K is not 0.30 in any real org we measured |
| Hiring reserves | $0 (folded in) | $0.30M | Partial-year + one-time costs invisible in top-down |
| Tools / infra | $0.48M | $0.20M | Top-down typically overstates because infra grew slower than headcount |
| Total | $5.94M | $6.65M | +$710K, ~12% |
The bottom-up number is $710K higher, and the gap concentrates in two lines: real overhead K is higher than 30%, and partial-year hiring costs that don't appear at all in the top-down view. The board can argue with the assumptions, which is a feature. The board cannot argue with a number that fell out of "last year + 10%" because there is nothing inside it to point at.
The contrarian claim, defended: the bottom-up budget is supposed to come in higher than the top-down one for healthy organizations. If your bottom-up is lower, you are probably modelling utilization at 100% or K at 0.20, and Q3 will reveal the error anyway, without time to course-correct.
Where this breaks: new orgs without baselines
Bottom-up budgeting works when you have at least six months of telemetry to calibrate utilization and K. New orgs and freshly-restructured teams don't. They have to make assumptions: utilization ≈ 0.78 for builders and 0.70 for managers is a reasonable starting point, K ≈ 0.35 for a small team and ≈ 0.42 for a large one is defensible. Then rebuild the budget after Q1 of the new fiscal year, with three months of real telemetry replacing the assumptions. Q1 recalibration catches most of the noise that would otherwise compound through Q3.
Historical replay via the Year Dropdown helps here too. Even in a new org, if you have monthly cost data from a comparable previous year (a different team, the same function at a previous company, an industry benchmark from McKinsey or Gartner), you can sanity-check the bottom-up against it. Rough beats a flat 30% multiplier you cannot defend.
What survives the audit
The reason finance teams budget bottom-up is that every line is defensible to a CFO who asks "where does that number come from?" Loaded rate comes from payroll plus K. K comes from monthly telemetry per department. Utilization comes from IDE coding time divided by paid hours. Hiring reserve comes from a per-head schedule with start dates. Tools come from contracts and seat counts.
Top-down has one defense: "last year plus inflation." It works in the boardroom for about ninety days. After that, every variance conversation circles back to "well, we just assumed it would scale linearly," and finance has no ground to push back on engineering when engineering is, in fact, running 12% hotter than plan.
The audit-survival test is simple: pick any line in your budget at random and ask whether you can name the inputs that produce it. If the answer is "we took last year and added a percentage," that line will fail review. If the answer is a chain of rate × utilization × hours × K × calendar shape, it survives.
For the related dollar accounting on individual features, see Cost per Feature: The SQL Formula That Actually Reconciles. For the role-shaped view of the same numbers, see CFO's Guide to Engineering Metrics and Engineering ROI: Calculating Real Return on Code. The companion piece on the data side is IT Budgeting With Data: same conversation, different angle.
The next time someone in your finance org says "we'll spend $X on engineering this year," ask which line in the build-up that number came from. If they can't point to one, you don't have a budget. You have a guess wearing a budget's clothes.