Budget Variance Analysis for Engineering: 5 Reasons Plan Misses Reality

You open the Q3 Plan-vs-Actual report. Planned engineering spend: $1.8M. Actual: $2.34M. Variance: +30%. The CFO wants to know why by Friday.
The textbook answer says "investigate any line where |actual − plan| > 10%". That's where most engineering variance reviews stop, and where they go wrong. A 30% gap on engineering cost has at least 5 distinct causes. Each one leaves a different signature in the data. If you don't decompose the variance, you end up firing the project manager when the real culprit was a retroactive raise round in August.
CIMA's variance analysis framework treats variance as a tree: rate variance × volume variance × mix variance. Engineering cost is messier, because labor isn't a uniform commodity. Below is the version that actually fits how dev teams burn money.
{/* truncate */}
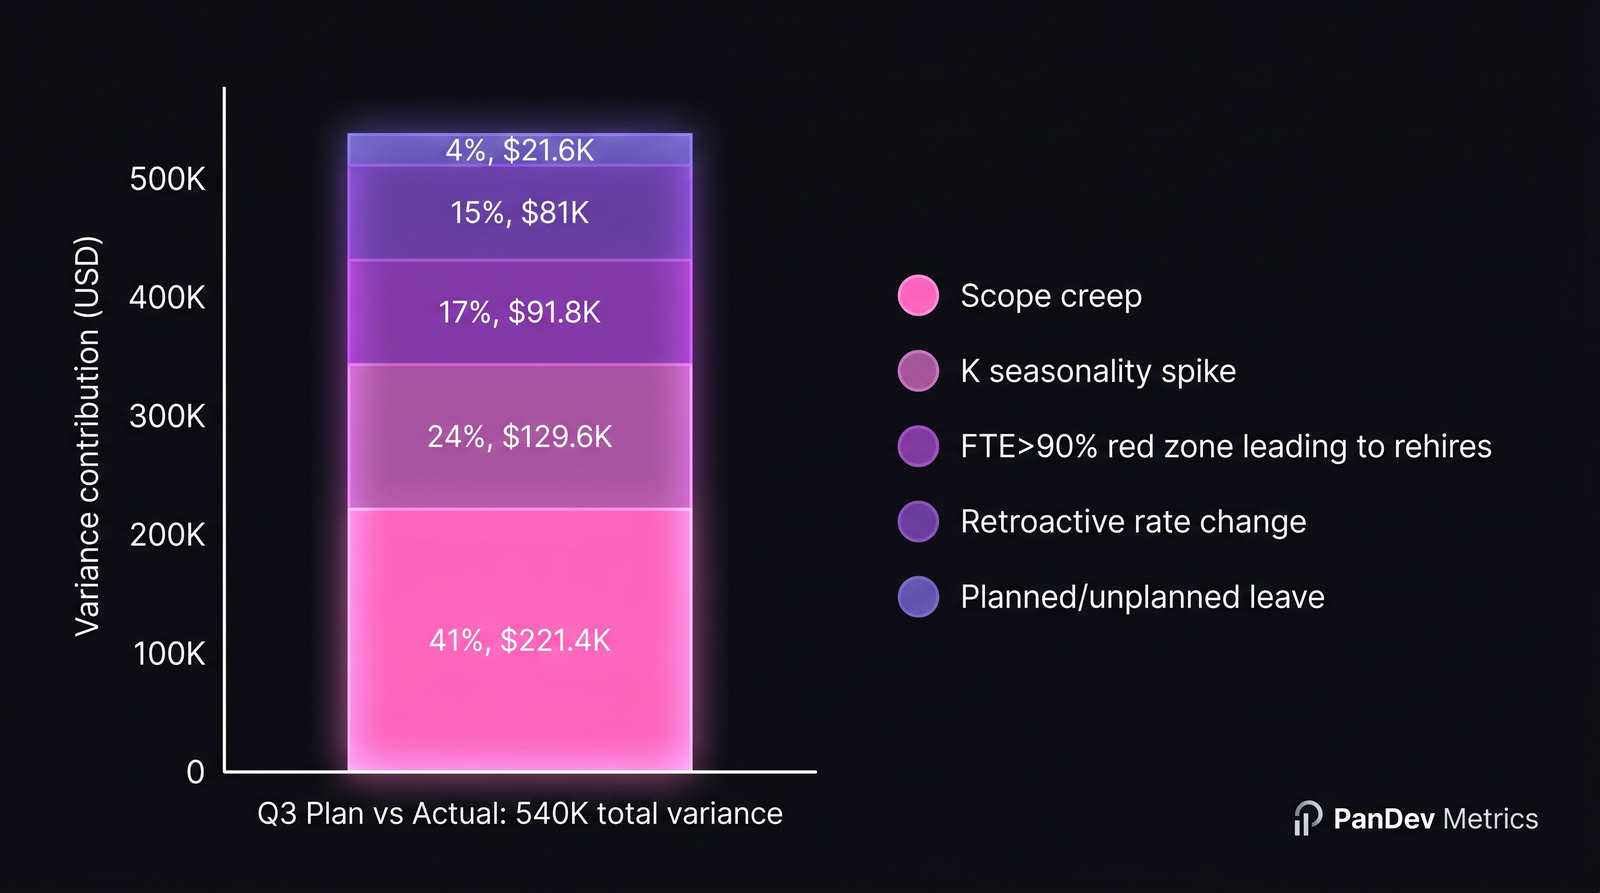 One real-world breakdown. Scope creep is the largest line; K seasonality is the most overlooked.
Stop staring at the gap. Start naming the cause.
Deloitte CFO Insights repeatedly flag engineering as the budget category with the lowest forecast accuracy. Two reasons: labor cost behaves seasonally, and scope is fluid. A 30% miss on rent is a billing error. A 30% miss on engineering is normal, unless you can attribute every percent.
Across ~40 mid-size B2B engineering orgs we observe through PanDev Metrics' Plan-vs-Actual module, quarterly variance > 15% breaks down into five recurring causes. The frequencies below are how often each cause is the single largest contributor to a quarter's overrun.
Table 1 — The 5 engineering variance causes
| # | Cause | Signature in data | Where to check in PanDev | Frequency as #1 cause | Avg share of variance |
|---|---|---|---|---|---|
| 1 | Retroactive rate change | Actual hourly rate jumps for past months | Loaded rate audit log; OverheadCoefficientFullRecalcCronJob history | 8% | 10–15% |
| 2 | Seasonal K spike | Same FTE, same hours, but cost-per-hour climbs in vacation months | OverheadCoefficient per-month chart | 28% | 20–30% |
| 3 | Scope creep | New issue_keys appear after sprint start; budgeted feature now twice the size | mv_activity_total_user_issue_daily issue-key delta | 35% | 30–45% |
| 4 | Capacity overrun (FTE > 90%) | Engineers consistently red-zone; rehires triggered | Employee Utilization Widget red counters | 16% | 15–25% |
| 5 | Unplanned leave gap | Sick leave / unplanned vacation covered by contractors at higher rate | CustomEmployeeWorkingTime overrides | 13% | 5–10% |
Two things stand out. Scope creep wins by raw frequency, which most CFOs already suspect. The bigger surprise: K spike is the most overlooked. It's invisible in headcount reports because no one was hired and no one quit, yet your cost-per-hour quietly went from 0.39 to 0.46 between June and August.
Cause #1 — Retroactive rate change (8%, signature: rates change for past months)
Someone approves a salary review in August, effective from June 1. Suddenly your June and July loaded hourly rates are higher than they were last week. Reports you ran in July looked clean. Reports you run in September show a $80K hole in Q2.
This one fires our OverheadCoefficientFullRecalcCronJob. When historical rates change, every dependent finance metric is recomputed from scratch. The signature is unambiguous: the same query against the same period returns different cost numbers across two runs. If your variance report shows the prior period moving, this is your cause.
The fix isn't analytical, it's operational: lock past periods after month-end close, treat retroactive raises as a separate line item, and flag the recalc in the variance commentary. Don't hide it in the noise.
For background on how this propagates through the cost stack, see our piece on retroactive rate change handling (next in this series).
Cause #2 — Seasonal K spike (28%, signature: cost up, hours flat)
The overhead coefficient K (ratio of paid time to coded time) is not constant. Summer destroys it. So do December holidays in some markets and Nauryz in CIS. We covered the math in per-month K seasonality, and the variance signature is the cleanest of the five: same FTE count, same task volume, same delivery cadence, but cost-per-feature climbs 15–20%.
In the worked example below, K went from 0.39 in Q2 to 0.46 in Q3. Same engineers. Same projects. Salary cost barely moved. But every coded hour now carried 18% more overhead. On a $1.8M plan, that alone is roughly $130K, a quarter of the entire variance from one coefficient.
Most planning tools don't model K monthly. Excel templates use an annual average, which is why summer always blows the budget and no one knows why.
Cause #3 — Scope creep (35%, signature: issue keys appearing late)
This is the obvious one, but most teams measure it wrong. They compare planned story points to delivered story points. The right comparison is planned issue keys vs. issue keys that ever touched the sprint. Our mv_activity_total_user_issue_daily materialised view keeps the daily set of touched keys, so you can replay which keys appeared on day 3 of a sprint that was scoped on day 0.
Two scope-creep patterns are common:
- Bolt-on: a new feature added after kickoff. Visible. Easy to defend.
- Stealth growth: an already-planned feature whose acceptance criteria expanded mid-sprint. Invisible in any tracker that doesn't version requirements.
We see roughly 220 dev-hours of stealth growth on a typical "1 quarter, 2 features" plan. At a loaded rate of $100/hr, that's $22K per feature, $44K for the quarter. On the worked example below, two features absorbed 220 dev-hours unplanned, contributing $220K to the variance.
DORA's State of DevOps reports that elite teams aren't faster per task. They have lower variance in cycle time. Same idea applies to budget variance: the metric that matters is consistency, not raw speed.
Cause #4 — Capacity overrun, FTE > 90% (16%, signature: red-zone counters spiking)
When engineers spend a quarter at >90% utilization, two things happen on a 90-day delay: people leave, and managers panic-hire. Both show up as variance two quarters later, not now. The leading indicator is the red-zone count in PanDev's Employee Utilization Widget: engineers above the 90% threshold for 4+ weeks running.
In our dataset, for every 1 engineer in red zone for 6+ weeks, there's a 38% chance of a backfill or net-new hire within 90 days. Each unplanned hire on a 40-person org is roughly 1–2% of the annual budget. Four red-zone engineers triggering two rehires = ~$90K of unplanned Q3 cost.
The honest read: this is a leading indicator, not a present-quarter explanation. By the time it shows up in variance, the damage is done. Watch the widget weekly, not the variance report quarterly.
Cause #5 — Unplanned leave gap (13%, signature: working-time overrides cluster)
Someone breaks a leg. Two engineers go on parental leave the same week. The team backfills with a contractor at $150/hr against a planned $90/hr loaded rate. Each CustomEmployeeWorkingTime override leaves a fingerprint: when you cluster them by month, leave gaps look very different from planned vacation.
Smallest of the five causes, but worth naming because it's frequently misclassified as scope creep. The data tell: scope creep grows the issue-key set; leave gaps grow the contractor-rate ratio.
Worked example — decomposing a 30% Q3 variance
A 40-person engineering org, $1.8M Q3 plan, $2.34M actual. Variance: $540K (30%). Here's the attribution:
Table 2 — Variance attribution for the example quarter
| Cause | Mechanism | Variance ($) | Share of $540K | Detection signal |
|---|---|---|---|---|
| Scope creep | 2 features absorbed 220 unplanned dev-hours | $220,000 | 41% | Issue-key delta in mv_activity_total_user_issue_daily |
| K seasonality spike | K rose from 0.39 → 0.46 (Jul–Sep) | $130,000 | 24% | Per-month K chart: jump > 10% MoM |
| FTE > 90% rehires | 4 engineers red-zone → 2 rehires | $90,000 | 17% | Utilization widget: red-zone count |
| Retroactive rate change | August raises effective June 1 | $80,000 | 15% | Loaded rate audit log delta |
| Unplanned leave coverage | 1 contractor backfill at $150/hr | $20,000 | 4% | CustomEmployeeWorkingTime overrides |
| Total | $540,000 | 100% |
Three things this view changes:
- The conversation with the CFO stops being "engineering overspent" and becomes "scope creep is 41%, K seasonality is 24%". Different problems, different owners, different fixes.
- The single most overlooked line, K spike at $130K, would never surface in a headcount review. Same people, same hours, more cost.
- The CFO's instinct to cut headcount actually addresses cause #4 (15% of variance), while leaving the bigger cause #3 (41%) untouched.
When PanDev's POST /departments/{id}/finance/projects endpoint returns percentageChange per project, it's the first cut at this attribution: a sorted list of where to look first. The decomposition above is what you do once you've picked the project that moved most.
How to wire variance alerts into the month-end loop
Variance analysis is post-hoc. The right time to do it is monthly, not quarterly. By the time the Q3 quarterly review lands in early October, the data is 90 days stale and the people who could have intervened in July have moved on to other fires. Set up monthly variance email alerts so issues surface inside the quarter, not after it.
A practical month-end checklist:
- Lock prior month rates. No retroactive edits without a flagged commentary.
- Run K for the month just closed; compare to trailing 12-month average. Flag > 5% delta.
- Pull issue-key delta per active sprint. Flag any sprint with > 15% issue-key inflation post-kickoff.
- Count red-zone engineers (utilization > 90%) for the month. Flag if count rose vs. prior month.
- List all
CustomEmployeeWorkingTimeoverrides applied in-month. Sum contractor-rate hours.
The whole loop runs in under an hour once instrumented. Compared with a quarterly post-mortem that's already historical, that's the difference between steering and reporting.
When this framework doesn't fit
- < 10 engineers: the noise floor on each cause is wider than the variance itself. Track totals, not decomposition.
- Pure project shop / agency model: client billing is the variance. Scope creep is a revenue event, not a cost event. Different math.
- Heavy contractor mix (> 40%): causes #4 and #5 dominate by design; the table reweights toward leave / overrun.
- First quarter on a new tracker: you don't have the issue-key history to detect scope creep cleanly. Wait one full quarter of data before trusting the attribution.
Related reading
- Bottom-up Engineering Budget Construction: the input side. How to build a plan you can later compare actuals against.
- Per-Month K: Seasonality and the Real Cost of Engineering: the math behind variance cause #2.
- Capacity Planning for Engineering: The Math, Not the Vibes: the math behind variance cause #4.
A 30% variance is information, not failure. The failure is closing the quarter without naming which of the five causes spent your money.