Build vs Buy: The Financial Model Most Teams Get Wrong

A CTO sees a $52K/year SaaS quote for a billing tool. Four engineers in the room, paid roughly $7K/month each loaded. The math is fast: "4 engineers × 4 months = 16 person-months. We can build this for $112K. Then it's free forever." The board nods. Procurement is told to cancel the SaaS evaluation. Eighteen months later, the team still owns the billing service, two engineers maintain it part-time, and the original four have shipped zero revenue features the quarter they were inside it. The real 5-year cost of "build" lands at $546K, almost double the SaaS path. Forrester's 2023 Total Economic Impact of Buy-vs-Build analysis put the median underestimate of in-house cost at 2.3×. Gartner's TCO frameworks have said the same thing for fifteen years. Most teams still don't multiply through.
{/* truncate */}
The comparison teams actually run
Walk into a build-vs-buy meeting and you'll see this whiteboard:
| Side | What gets counted |
|---|---|
| Buy | SaaS subscription (annual line item) |
| Build | Engineers × months × loaded rate |
That's it. Two numbers. Buy looks expensive because it has a recurring price tag. Build looks cheap because it's just internal salary you're "already paying." The decision is made before anyone questions the model.
The model is wrong on both sides. It under-counts build by a factor of 2-3× and slightly under-counts buy by a smaller margin. The bias is asymmetric. Net effect: build wins decisions it shouldn't.
What the honest comparison includes
Here's what gets missed:
| Cost component | Build | Buy |
|---|---|---|
| Direct development hours | counted | n/a |
| Loaded overhead (K coefficient) | usually missed | n/a |
| Maintenance forever (0.3-0.7 FTE) | usually missed | minimal |
| Opportunity cost (engineers not on revenue work) | almost always missed | n/a |
| Subscription / license | n/a | counted |
| Integration cost (1-time) | n/a | sometimes missed |
| Customization tax (ongoing) | n/a | usually missed |
| Vendor risk (price hikes, sunset) | n/a | rarely modeled |
| Switching cost if vendor fails | n/a | almost always missed |
The two columns fail asymmetrically. Build misses recurring costs (maintenance, opportunity); Buy misses risk-adjusted costs (vendor lock-in, customization). The dollar impact of the build misses is usually larger because they compound over the asset's lifetime.
The four hidden costs of "build"
1. Loaded rate, not salary-divided-by-hours
A $5,000/month engineer doesn't cost $5,000. They cost $5,000 plus a slice of the EM, the DevOps engineer who keeps CI alive, the HR partner, the office, the licenses, and the planning meetings. The accounting-standard formula is loaded_rate = direct_rate × (1 + K) with K typically running 0.3 to 0.6 depending on org. We covered the math in Loaded Hourly Rate: Why Your Engineer Costs 50% More Than Their Salary. If your build estimate uses raw salary, multiply it by 1.4 immediately. That alone often flips the decision.
2. Maintenance is forever, not "we'll figure it out"
Internal tools don't ship and stop. They ship and start a long, quiet maintenance tail. The library you depended on releases a security patch, somebody updates. The Postgres minor version changes, somebody re-tests. A sales-team rep calls finance asking why one customer's invoice broke, somebody debugs. The empirical rule across the industry: ongoing maintenance is 0.3 to 0.7 FTE per service per year. Sustainably. Forever.
For a 5-year horizon at 0.5 FTE × $7K/month loaded × 12 = $42K/year × 5 = $210K. That number rarely appears in the original build estimate.
3. Opportunity cost: the engineers aren't free
Four engineers spending four months on internal billing means four engineers not spending four months on the next paid feature. The cost of that gap is the Cost of Delay on whatever they would have been building, typically $10-20K per engineer per week for a B2B SaaS team with active pipeline. Conservative math: 4 engineers × 16 weeks × $14K/week median CoD per engineer-equivalent = $224K of revenue or pipeline that simply doesn't get unlocked because the team is heads-down on plumbing.
a16z's State of SaaS Adoption 2023 makes this point bluntly: the strongest predictor of B2B startup growth velocity isn't engineering headcount, it's whether the team protects its small number of engineers from undifferentiated work. Build-it-ourselves on commodity functionality is the canonical undifferentiated-work trap.
4. The K coefficient lies if you use a flat one
A 1.4× multiplier on the build cost is better than nothing, but K is time-varying. We covered the seasonality in Cost per Feature: The SQL Formula That Actually Works in Production. For an honest 5-year TCO model, use the per-month K average for the relevant team rather than a flat industry number. Typically the gap is 5-15% in either direction.
A real worked example
A B2B SaaS company evaluating an internal billing service. Two paths.
Path A: Buy (Stripe Billing or similar vendor)
| Year | Subscription | Integration | Total |
|---|---|---|---|
| Y1 | $52,000 | $15,000 (one-time) | $67,000 |
| Y2 | $52,000 | 0 | $52,000 |
| Y3 | $52,000 | 0 | $52,000 |
| Y4 | $52,000 | 0 | $52,000 |
| Y5 | $52,000 | 0 | $52,000 |
| 5-year total | $260,000 | $15,000 | $275,000 |
Path B: Build
| Component | Calculation | Cost |
|---|---|---|
| Initial dev | 4 engineers × 4 months × $7K loaded | $112,000 |
| Maintenance | 0.5 FTE × $7K × 12 × 5 years | $210,000 |
| Opportunity cost | 4 engineers × 16 weeks × $14K/wk CoD | $224,000 |
| 5-year total | $546,000 |
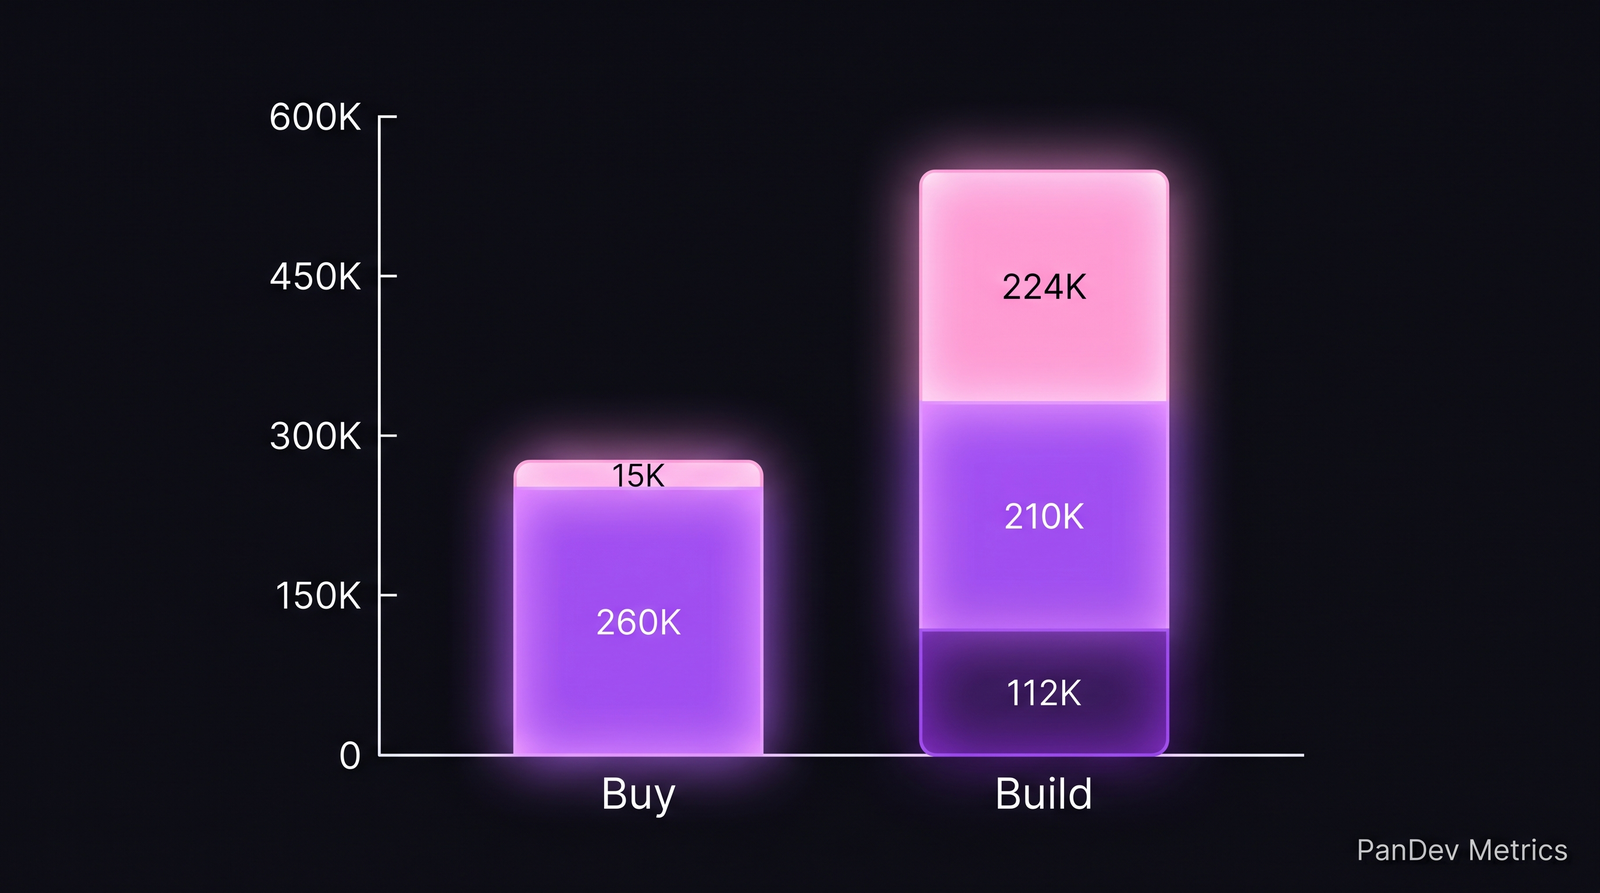 5-year TCO. Buy is one purple subscription block plus a small pink integration tax. Build stacks initial dev, maintenance, and the opportunity-cost layer most teams forget to count.
Two numbers, side by side: $275K versus $546K. The "build is cheaper" intuition is off by $271K, or 99% of the buy cost. And that's before vendor-risk adjustments on the buy side.
A senior CTO reading this will want to argue the opportunity-cost line. Fine, strip it out. Build still costs $322K versus $275K for buy. Buy still wins by $47K. The maintenance tail alone is enough to flip the decision; the opportunity cost just makes the gap unmistakable.
Where this calculation lives in the operating system
Most companies discover the gap retroactively. A 5-year-old internal tool gets re-evaluated. Someone runs the numbers. The honest answer comes back and there's nothing to do; the cost is already paid.
The fix is to compute build-vs-buy with the same machinery you compute every other engineering cost. PanDev Metrics tracks activity_events per feature; the same time aggregation that computes cost per feature for in-house work also computes integration cost for vendor work. Same SQL, same K coefficient, same hourly rates. When a CTO asks "what did our Stripe integration cost vs what would Stripe Billing have cost us to build?", the data is already there to answer truthfully.
This matters at calibration time. A team's first build-vs-buy estimate is always a guess. By the third one, if you've tracked the previous two with real telemetry, the estimate gets sharp. "We said the SSO integration would take 6 weeks. It took 11. The next time we say 6, we know to double it."
Vendor risk: the case where build still wins
The model above isn't a pure call to outsource everything. There are cases where build wins on TCO too:
- Mission-critical infra where vendor downtime means your downtime, and SLA penalties don't cover the reputational damage.
- Core product differentiation: anything that's part of why customers buy your product. Building this is by definition an investment, not undifferentiated work.
- Regulatory contexts (FedRAMP, HIPAA, on-prem only) where vendors literally cannot serve the use case.
- Long-tail vendors with no pricing power floor: niche tools where the vendor could 10× the price next year and you'd have to pay or rebuild.
Bessemer's State of the Cloud 2024 report lists the canonical pattern: top quartile B2B SaaS companies spend on average 18% of headcount on differentiating product features and 82% on commodity work, and then ask whether each commodity bucket can be bought instead of built. The successful ones aggressively externalize the 82%.
The two-rule simplification: build for moats, buy for plumbing. A billing engine, a feature flag service, a monitoring dashboard, a CRM, all plumbing. A pricing engine that encodes your unique business model, the recommendation algorithm that defines your product, the latency-critical path your customers experience: moats. Don't outsource moats. Don't build plumbing.
What the model can't tell you
This calculation assumes the SaaS vendor will exist in five years and not pull a GitLab-style price hike or a sunset announcement. Vendor risk is real. We don't try to encode it as a probability multiplier in the TCO line; that creates fake precision. The honest framing: add 15-25% to the buy column as a vendor-risk reserve, and even with that reserve, the model still favors buying for most plumbing categories.
The other limit: this article reasons over a 5-year horizon. If your business has a clear 10-year roadmap and the tool is unlikely to be replaced, the maintenance tail dominates more aggressively in build's favor at year 7+. We don't have IDE-telemetry data on 10-year-old internal tools; by then, most of them have been deprecated or bought out anyway.
The CTO who wins this argument isn't the one who proves build is cheaper. It's the one who runs the comparison with all four hidden costs in the build column, the integration and risk columns in the buy side, and lets the numbers settle. Most of the time, the SaaS line item is the cheap option, by the same margin teams thought they were saving. Go in eyes-open about which side of the moat-vs-plumbing line each decision sits on.