5 Data Patterns That Scream 'Your Developer Is Burning Out'

Nobody quits on a Monday. The resignation email you receive on a random Thursday was written — emotionally — six weeks ago. The disengagement started three months ago. And the data saw it coming the entire time.
The 2023 Stack Overflow Developer Survey found that over 70% of developers reported some level of burnout symptoms. Replacing a mid-level software engineer costs an estimated 50-200% of their annual salary when you factor in recruiting, onboarding, and lost institutional knowledge. The SPACE framework (Forsgren et al., 2021) explicitly includes "Satisfaction and well-being" as a core productivity dimension — recognizing that burned-out developers aren't just unhappy, they're materially less productive. But the signals are visible in activity data long before the resignation letter.
Here are five patterns that show up in IDE activity data weeks — sometimes months — before a developer burns out or leaves.
{/* truncate */}
Pattern #1: The Disappearing Evening Spike
What it looks like
A developer who used to code in the evenings stops. Not because they've improved their work-life balance — but because they've lost the internal motivation to engage with code outside required hours.
The data pattern
| Time period | Before (engaged) | Transition (early warning) | After (burned out) |
|---|---|---|---|
| 9 AM – 12 PM | High activity | High activity | Medium activity |
| 12 PM – 5 PM | High activity | Medium activity | Low activity |
| 5 PM – 8 PM | Medium activity | Low activity | Zero |
| Weekends | Occasional commits | Zero | Zero |
This pattern is counterintuitive. You might think "great, they stopped working evenings — they're taking care of themselves." But when a previously engaged developer suddenly drops to zero off-hours activity, it often signals a loss of interest, not healthy boundary-setting.
The key is the context of the change. If a developer proactively sets boundaries and maintains or improves their daytime output, that's healthy. If evening coding disappears alongside declining daytime Focus Time and increasing short sessions, it's a warning sign.
Why it matters
Intrinsic motivation — coding because you want to, not because you're told to — is one of the strongest signals of engagement. When it vanishes from the data, disengagement has already begun.
Pattern #2: The Boom-Bust Cycle
What it looks like
Alternating weeks of intense overwork followed by weeks of minimal activity. The developer swings between 4+ hours of daily coding and less than 30 minutes, with no middle ground.
The data pattern
| Week | Daily coding time | Focus sessions | Pattern |
|---|---|---|---|
| 1 | 240 min | 3 long | BOOM |
| 2 | 210 min | 3 long | BOOM |
| 3 | 25 min | Short only | BUST |
| 4 | 15 min | Minimal | BUST |
| 5 | 260 min | 4 long | BOOM |
| 6 | 20 min | Minimal | BUST |
Our platform data across B2B engineering teams shows the median developer codes 78 minutes per day with relatively stable consistency — a figure consistent with McKinsey's finding that developers spend only 25-30% of their time coding. Developers exhibiting boom-bust patterns often average the same 78 minutes — but the variance is extreme.
Why it matters
This pattern indicates a developer who is coping with burnout through intermittent recovery, rather than addressing the root cause. They push until they crash, recover just enough to function, then push again. Each cycle depletes reserves further.
A developer showing this pattern in PanDev Metrics' Activity Time chart will have a sawtooth graph instead of a steady line. The Productivity Score — which factors in consistency — will reflect this instability.
What managers miss
The average looks fine. If you only check monthly totals, the boom weeks compensate for bust weeks. It's only when you look at daily or weekly granularity that the pattern emerges.
Pattern #3: The Shrinking Focus Session
What it looks like
A developer's Focus Time sessions get progressively shorter over weeks. They used to code in 90-minute blocks. Then 60 minutes. Then 30. Now they can barely maintain 15 minutes of continuous coding.
The data pattern
| Month | Avg. Focus session length | Sessions per day | Total Focus Time |
|---|---|---|---|
| January | 72 min | 2.1 | 151 min |
| February | 58 min | 2.3 | 133 min |
| March | 41 min | 2.8 | 115 min |
| April | 23 min | 3.5 | 81 min |
Notice the total Focus Time decreases, but the number of sessions increases. The developer is trying to work — starting sessions more often — but can't maintain concentration. This is a hallmark of cognitive exhaustion.
Why it matters
The inability to sustain focus is one of the earliest and most reliable indicators of burnout, consistent with Gloria Mark's research on attention fragmentation (UC Irvine). If a developer can no longer maintain the 23+ minutes of uninterrupted focus needed to enter a productive state, their effective output collapses — and this often precedes visible symptoms like missing deadlines or declining code quality by weeks.
PanDev Metrics' Focus Time metric captures this directly. When you see a downward trend in average session length, it's time for a conversation — not about performance, but about wellbeing.
Pattern #4: The Language/Project Scattering
What it looks like
A developer who normally works in 1-2 languages or projects starts touching many files across many projects without depth in any.
The data pattern
| Month | Primary language % | Projects touched | Avg. time per project |
|---|---|---|---|
| Normal | 75% (TypeScript) | 2 | 85% of time in main project |
| Warning | 55% (TypeScript) | 4 | 40% of time in main project |
| Critical | 30% (TypeScript) | 6+ | < 20% in any single project |
In our production data, the top three languages — Java (2,107 hours), TypeScript (1,627 hours), and Python (1,350 hours) — dominate individual developer profiles. Most developers spend 70-80% of their time in one primary language.
When this concentration drops sharply, it often means:
- The developer is avoiding their main project (subconsciously or deliberately)
- They're being pulled into too many contexts (a management problem)
- They're looking for new stimulation because their main work has become emotionally draining
Why it matters
Context switching is expensive (research shows 20-80% productivity loss depending on task complexity), but when a developer starts voluntarily scattering across projects, it signals disengagement from their primary work. They're seeking novelty — a common coping mechanism for burnout.
Pattern #5: The Weekend Creep
What it looks like
A developer who rarely coded on weekends starts showing consistent Saturday and Sunday activity. Not the occasional "I had an idea and wanted to try it" session, but regular multi-hour weekend coding.
The data pattern
| Phase | Weekend coding hours | Weekday coding hours | Total weekly |
|---|---|---|---|
| Healthy | 0-1 hr | 6-9 hr | 6-10 hr |
| Early warning | 2-4 hr | 8-10 hr | 10-14 hr |
| Critical | 4-8 hr | 8-10 hr | 12-18 hr |
| Pre-burnout | 4-8 hr | 5-7 hr (declining) | 9-15 hr |
The dangerous phase is the last one: weekend hours stay high while weekday hours drop. The developer has shifted their productive time to weekends — possibly because weekdays are filled with meetings, or because they can only focus when nobody else is online.
Our data shows that weekend coding activity is approximately 3.5x lower than weekday activity across the overall dataset. When an individual developer's weekend-to-weekday ratio significantly exceeds the population average, it's a signal worth investigating.
Why it matters
Weekend work isn't inherently bad. Many developers enjoy weekend side projects. The warning sign is sustained weekend work on company projects combined with declining weekday productivity. This means the developer has lost productive hours during the week (usually to meetings and interruptions) and is compensating on their own time — an unsustainable pattern.
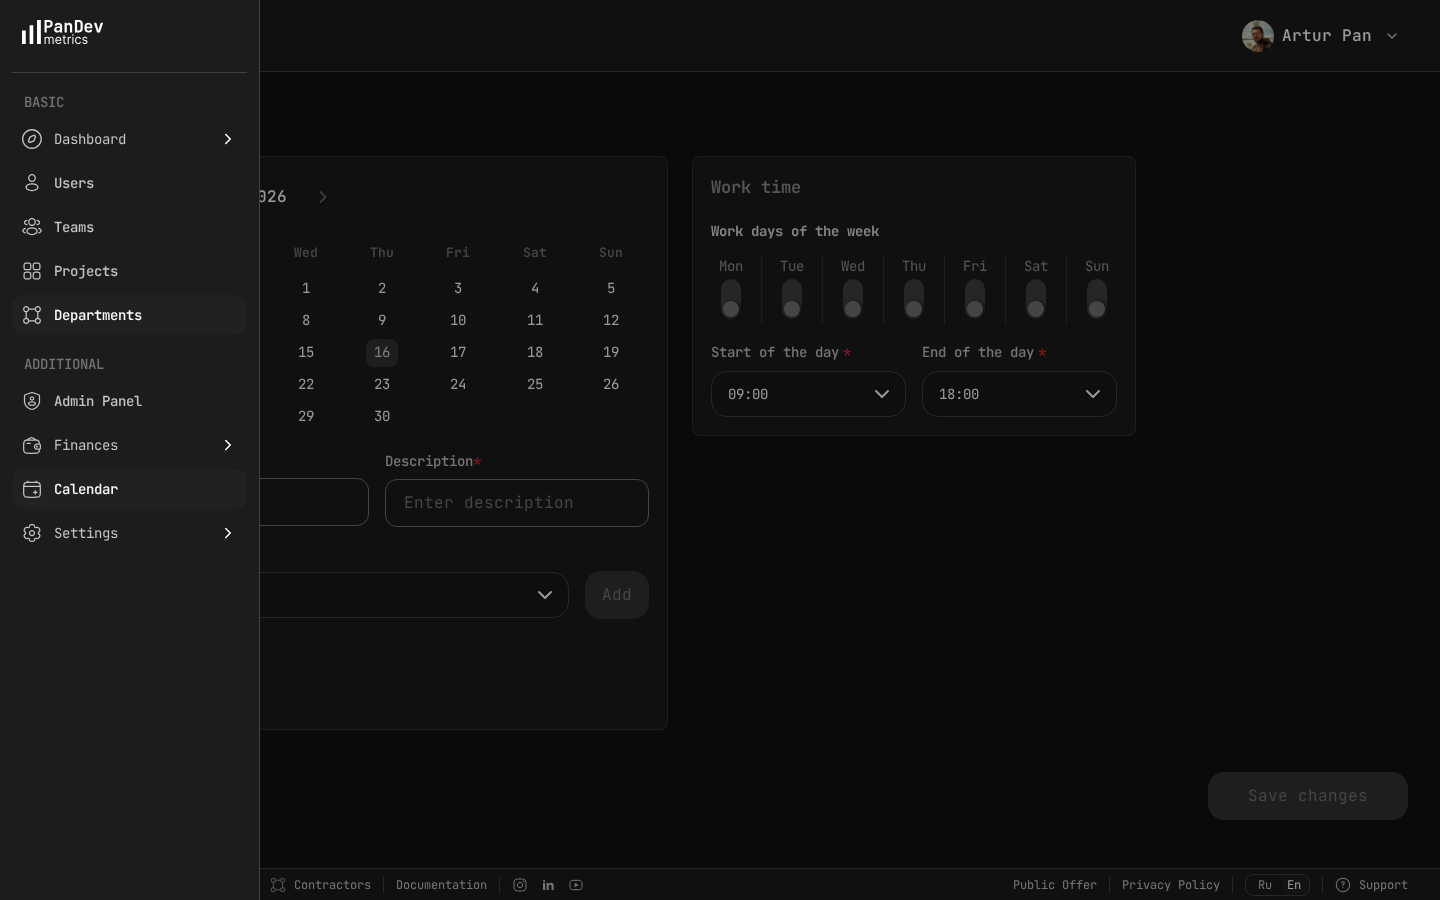 PanDev Metrics calendar settings — define standard work days (Mon-Fri) and hours (09:00-18:00) so the system can flag after-hours and weekend activity as potential burnout signals.
How to Use This Data Without Being Creepy
Let's address the elephant in the room: tracking developer activity can feel invasive. There's a line between protecting your team and surveilling your team, and it's important to stay on the right side.
Principles for ethical burnout detection
| Do | Don't |
|---|---|
| Track aggregate patterns over weeks | React to a single day's data |
| Use data to start conversations | Use data to make accusations |
| Share dashboards with the developer | Keep data hidden from the people it's about |
| Focus on team-level trends first | Single out individuals without context |
| Frame as wellbeing support | Frame as performance management |
| Respect opt-out preferences | Make tracking mandatory without discussion |
PanDev Metrics is designed around this philosophy. Developers can see their own data. Managers see team-level aggregates first, individual patterns only when they need to have a supportive conversation.
The right conversation to have
When you see these patterns, don't say: "Your coding hours are down, what's going on?"
Instead say: "I've noticed some changes in our team's work patterns and I want to check in. How are you feeling about your workload? Is there anything blocking your ability to do focused work?"
Make it about the environment, not the person. Burnout is a systemic problem, not an individual weakness.
Building a Burnout Detection System
Step 1: Establish baselines (Month 1)
Collect data for at least 4 weeks before establishing what "normal" looks like for each developer. People have different patterns — a developer who naturally codes 200+ minutes daily isn't burning out when they hit 180 minutes.
Step 2: Set change-detection thresholds
| Metric | Normal variance | Warning threshold |
|---|---|---|
| Daily coding time | ±20% week-over-week | > 30% decline for 2+ weeks |
| Focus session length | ±15% | > 25% decline over 4 weeks |
| Weekend-to-weekday ratio | 0-0.15 | > 0.35 for 3+ weeks |
| Project scatter (Herfindahl index) | > 0.5 | < 0.3 for 2+ weeks |
| Boom-bust variance (CoV) | < 0.3 | > 0.6 for 4+ weeks |
Step 3: Create intervention protocols
| Alert level | Trigger | Action |
|---|---|---|
| Yellow | 1 pattern detected for 2+ weeks | Manager mental note, observe |
| Orange | 2 patterns detected, or 1 for 4+ weeks | 1:1 check-in, offer support |
| Red | 3+ patterns, or sustained decline over 6+ weeks | Workload restructuring, potential time off |
Step 4: Measure and iterate
Track whether interventions actually help. If a check-in conversation leads to meeting reduction, does the developer's Focus Time recover? If you mandate a week off, does the boom-bust pattern stabilize? Use the same data that detected the problem to verify the solution.
The Cost of Doing Nothing
The average cost of developer turnover is significant — recruiting, onboarding, ramp-up time, and lost productivity typically add up to 6-9 months of salary for a mid-level engineer.
But the cost of a burned-out developer who stays is often worse:
- Reduced code quality leads to more bugs and tech debt
- Disengagement spreads to teammates
- Innovation and initiative drop to zero
- The team works around the person, reducing everyone's efficiency
Data-driven burnout detection isn't about surveillance. It's about seeing the problem while there's still time to fix it.
Based on aggregated, anonymized patterns from PanDev Metrics Cloud (April 2026), thousands of hours of IDE activity across B2B engineering teams. No individual developer data was used in this analysis — patterns described are composites of observed trends. References: SPACE framework (Forsgren et al., ACM Queue, 2021); Gloria Mark, "The Cost of Interrupted Work" (UC Irvine, 2008); Stack Overflow Developer Survey (2023).
Want to protect your team from burnout before it happens? PanDev Metrics tracks Activity Time, Focus Time, and work pattern consistency — giving engineering managers the data to have the right conversation at the right time.