Engineering Capacity Planning: The Math Behind Q3 Roadmap

A team of 6 engineers, 60 working days, 8 hours each. The PM walks into the planning room with 2,880 dev-hours of capacity on the slide. Q3 roadmap fits in 2,400. Comfortable buffer. Three months later 40% of the roadmap is late and the postmortem blames "scope creep."
There was no scope creep. The capacity number was wrong on day one. Stanford economist John Pencavel's hours-and-productivity study shows output per hour starts collapsing past 49 hours per week, long before you hit 60. Microsoft Research and UC Irvine's Gloria Mark added the second blade: every interruption costs an average 23 minutes 15 seconds to fully recover focus. Stack those two findings on top of any 8-hour calendar and you get something far less than 8 productive hours of real output.
{/* truncate */}
The formula nobody writes down
Most planning treats capacity as an arithmetic problem: team × hours × days. It's a multiplicative one:
effective_hours = team_size
                × FTE_utilization
                × calendar_hours
                × velocity_multiplier
                × (1 - context_switching_tax)
Each multiplier between 0 and 1 trims the headline number. A 100%-utilized, 100%-velocity, zero-context-tax team does not exist in any dataset we've ever seen, including our own. The default arithmetic-only assumption inflates capacity by 35-55%, which lines up with Atlassian's State of Teams finding that the average sprint commits to roughly 1.4× what gets delivered.
This article walks the math, then plugs real numbers from a 6-person team to show why 960 calendar hours collapse to 520 real ones.
The four multipliers, source by source
The trick is that none of these are estimated. Each one is measurable from telemetry your team already produces.
Multiplier 1: FTE utilization
Calendar hours assume a developer is at the keyboard for 160 hours every month. Real IDE telemetry says otherwise. We covered this in FTE utilization vs hours logged: the median across our B2B dataset sits at 65-75% sustained utilization across a 90-day window. Past 90% you're already buying burnout, not capacity.
In PanDev Metrics this comes from f_mv_activity_total_user_daily_today(), a function that returns live FTE for every individual against their CustomEmployeeWorkingTime baseline (so a 4-day-week contractor reads against 128h, not 160). For department-level planning we average mv_activity_total_user_daily over the previous 90 days; that's the input to your real-capacity formula.
Multiplier 2: Velocity (the onboarding tax)
A senior engineer who shipped two features last quarter has velocity 1.0. A new hire two weeks in does not. DORA's State of DevOps 2024 measured a 6-9 month ramp curve before new engineers match team-mean throughput on changes-per-week. We treat that as a sliding multiplier:
| Engineer state | Velocity multiplier |
|---|---|
| New hire, week 1-4 | 0.30 |
| Onboarding, month 2-3 | 0.60 |
| Ramping, month 4-6 | 0.85 |
| Steady-state senior | 1.00 |
| 10+ year tenure on this codebase | 1.05 |
It's a weighted average. Five seniors and one new hire on a 6-person team gives (5 × 1.0 + 1 × 0.6) / 6 = 0.93. Sounds harmless, except it compounds with the next two multipliers.
Multiplier 3: Context-switching tax
Mark's lab work is the floor; production data is worse. Microsoft's Worklab study showed knowledge workers in 2022 hit a "triple peak" workday with sustained focus blocks shrinking quarter over quarter. We measure context switches via project-tag transitions in IDE heartbeats. The median project-switching tax we observe sits in the 15-22% range across the dataset, hitting 30%+ on teams with 4+ parallel features in flight.
Use these brackets:
| Parallel features in flight | Context tax |
|---|---|
| 1 | 5% |
| 2 | 12% |
| 3 | 18% |
| 4 | 25% |
| 5+ | 32% |
This is also covered from a focus-time angle in Deep work schedules for developers, the inverse view of the same number.
Multiplier 4: Calendar hours
The honest one. 160 hours per month is the FTE convention; your actual calendar is different in months with public holidays, parental leave, planned PTO, and on-call rotations. Custom calendars in PanDev Metrics live in CustomEmployeeWorkingTime, indexed by userId × month, so a planner can pull 6 individual baselines and sum them rather than slapping a flat headcount × 160 on the slide. In a typical Q3 across the teams we measure, the calendar variance alone (one parental leave, two weeks of accumulated PTO, one regional holiday cluster) shaves 8-12% off the headline number before any of the other multipliers fire.
The decomposition table
Same 6-person team. One quarter. Numbers from our own dataset, rounded:
| Step | What's deducted | Hours remaining |
|---|---|---|
| Calendar headline | 6 × 160h × 1 month | 960h |
| − FTE utilization | × 0.71 (90-day avg) | 682h |
| − Velocity weighting | × 0.93 (one new hire) | 634h |
| − Context-switching tax | × 0.82 (4 parallel features) | 520h |
| Real monthly capacity | 520h (54% of calendar) |
Five hundred twenty hours. The headline said 960. That gap of 440 hours is what breaks roadmap commitments. Not scope creep. Not team failure. Math that was wrong on slide one.
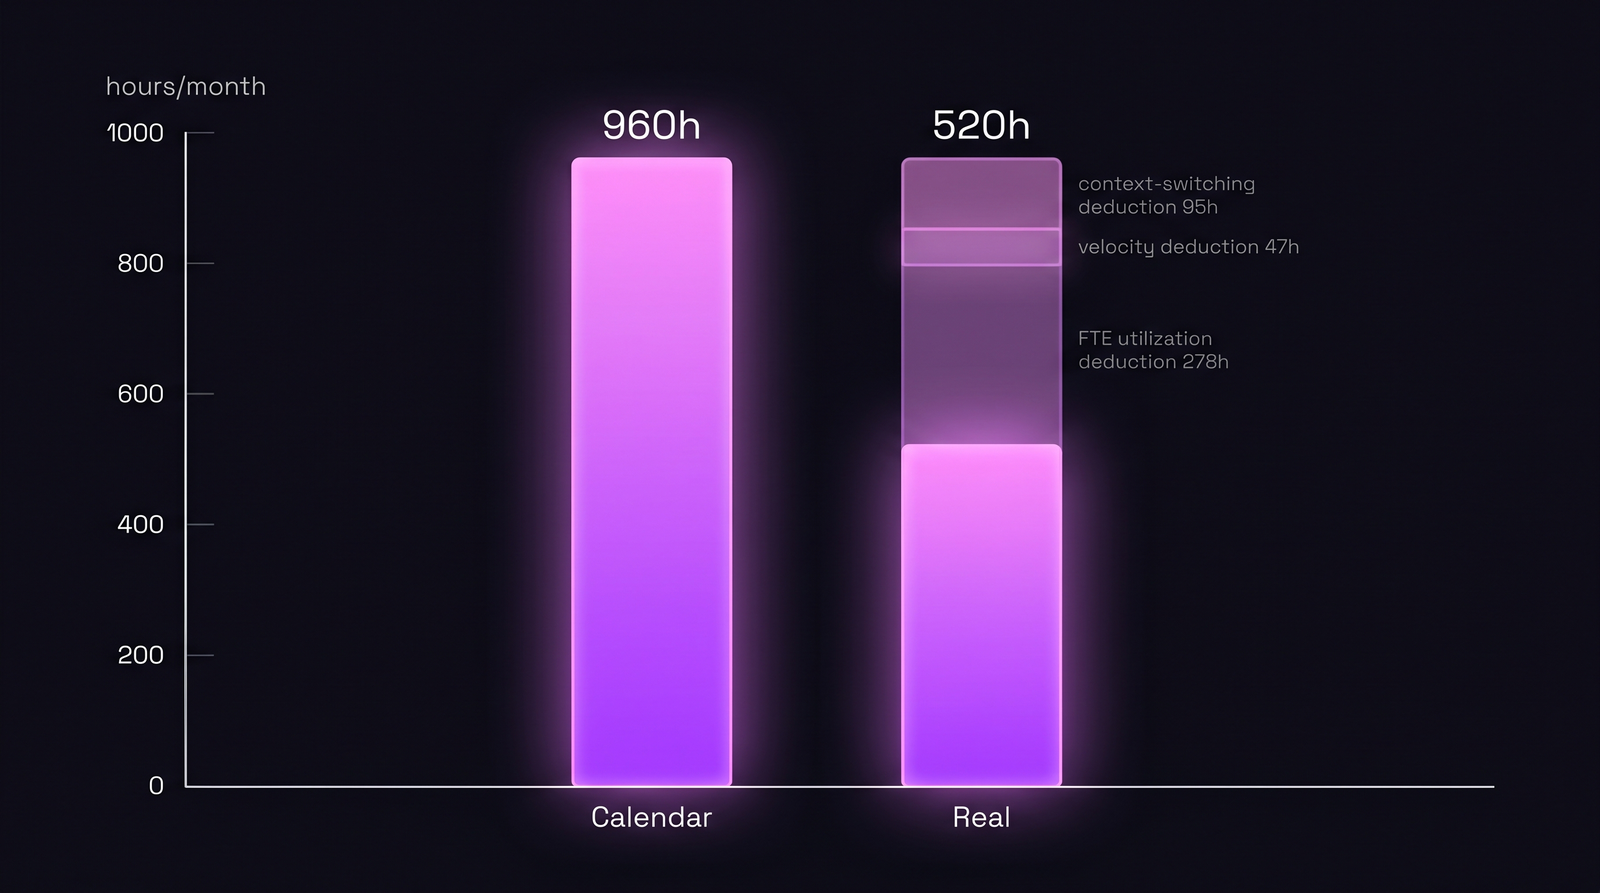 Same team, same month. Calendar shows 960h. Real capacity after the four multipliers: 520h.
Three quarters of the same team — predicted vs actual
Where this formula earns its keep is comparing prediction to delivery. Same 6-person team across Q1, Q2, Q3 of 2026:
| Quarter | Calendar | Formula prediction | Actual delivered | Variance |
|---|---|---|---|---|
| Q1 (steady) | 2,880h | 1,580h | 1,610h | +1.9% |
| Q2 (new hire week 6, 5 features in flight) | 2,880h | 1,290h | 1,240h | −3.9% |
| Q3 (full team, 2 features focus) | 2,880h | 1,790h | 1,750h | −2.2% |
Variance under 5% in each quarter. The PM who used the calendar number (team × 160h × 3 = 2,880h) would have committed to 1.6-1.8× what got delivered every quarter. The PM using the four-multiplier formula committed to almost exactly what shipped.
This is the same input data that powers the employee utilization heatmap and delivery index without LOC: different views, same telemetry.
Where the formula lives in PanDev Metrics
Three places where the inputs are already on your screen:
/dashboard/finances/employee/:userId→ utilization widget shows individual FTE history with the same 90-day window the formula uses.- Department view → aggregates
mv_activity_total_user_dailyacross reports. This is what you sum into the team-level multiplier. CustomEmployeeWorkingTime→ the override layer. Parental leave at 50%, regional holidays in the Almaty office, sabbaticals: all read against adjusted baselines, not flat 160h. Without this layer the FTE multiplier silently lies for any non-standard schedule. We learned this the hard way during our own on-prem rollout: a 50%-schedule engineer was reading at 95% utilization on the heatmap because the denominator hadn't been overridden, and the planner nearly redistributed work assuming overload that wasn't real.
The product reference here isn't a pitch. The four numbers you need (utilization, velocity weighting, context tax, custom calendar) are computed continuously from the same IDE heartbeat stream, so the formula isn't quarterly guesswork. It's a SELECT query.
What this changes about planning
Three concrete shifts that fall out of the math.
Stop committing to median capacity
The 520h number is a median. Half the time the team will deliver less. Atlassian's research shows commitment-to-delivery variance is roughly ±15% even for stable teams, so committing to 520h means you ship 442-598h depending on the month. Roadmaps committed at the median miss roughly half the time. Plan against median minus 15-20% buffer for unknowns: sick days, on-call fires, dependency delays, the production incident on day 11 that eats two seniors for a week.
Cap parallel features at 3
The context-switching tax jumps from 18% to 25% when you go from 3 to 4 parallel features. That's roughly 70 hours of capacity evaporating, more than a full week of one engineer, in exchange for "we're working on more things." The math says don't. The contrarian read: a team that ships 3 features in parallel will out-deliver the same team trying to ship 5 by a full week of capacity per month, even though the second team looks busier in the standup.
Recompute the formula every month
FTE utilization drifts. Velocity changes when senior engineers leave. Context tax spikes when an outage adds an unplanned firefight stream. The four-multiplier formula isn't a planning constant; it's a monthly recompute. Teams that recompute at the start of every quarter consistently land within 5% of plan; teams that set it once and freeze it eat the variance back as missed dates.
Honest limit: capacity is a distribution, not a number
Even with all four multipliers, you have a median, not a forecast. The buffer is non-optional. The numbers above come from a sample of 30+ B2B engineering teams in our dataset: distributed teams in fintech, SaaS, and on-prem regulated spaces. Solo developers and large open-source projects behave differently. We don't have signal on those, and the multipliers above will likely overshoot or undershoot depending on the rhythm.
The strongest claim we'll make: if you commit to median capacity with no buffer, you will miss roadmap roughly 50% of the time. Add 15-20% and you cover most of the variance most of the time. Anyone selling you a tighter forecast than that is either lucky or lying.
What to do tomorrow
Pull last 90 days of FTE utilization for your team. Multiply by the velocity-weighting table. Subtract the context-switching tax bracket matching your parallel feature count. Compare to the calendar number you've been planning against.
If the gap is over 35%, your roadmap is currently committing to capacity that doesn't exist. The fix isn't working harder. The fix is committing to the number the data actually supports, then defending it in the planning room with the four-multiplier table.