Change Failure Rate Explained: Why 15% Is Normal and 0% Is a Red Flag

When a VP of Engineering tells me their Change Failure Rate is 0%, I don't congratulate them. I ask what they're not counting. Stripe's 2018 "Developer Coefficient" study estimated that $300 billion is lost globally to bad code and inefficient processes — and much of that loss hides behind unrealistic quality metrics. A 0% CFR almost always means the team either deploys so rarely that each release is over-tested to the point of paralysis, or — more commonly — they have a definition of "failure" so narrow that real incidents don't qualify.
{/* truncate */}
What Change Failure Rate Measures
Change Failure Rate (CFR) is the percentage of deployments that cause a failure in production. "Failure" means the deployment requires a remediation action: a rollback, a hotfix, a forward-fix, or a patch.
The DORA benchmarks from the 2023 State of DevOps Report:
| Performance Level | Change Failure Rate |
|---|---|
| Elite | 0–15% |
| High | 0–15% |
| Medium | 16–30% |
| Low | 46–60% |
Notice something unusual: Elite and High performers share the same range. The researchers found that CFR doesn't meaningfully differentiate top performers. What differentiates them is how quickly they recover (MTTR) and how often they deploy (Deployment Frequency).
This is a critical insight. Optimizing for zero failures is the wrong goal.
Why 0% Change Failure Rate Is a Red Flag
A 0% CFR typically signals one of these problems:
1. You're Not Counting Properly
The most common cause. Teams exclude:
- Incidents that were "caught" before users noticed. If your monitoring caught a spike in 500 errors and you rolled back within 5 minutes, that's still a failure. The deployment caused a production issue.
- Feature bugs discovered after deploy. If a feature doesn't work as intended and requires a follow-up fix, the original deployment failed.
- Performance degradations. Latency doubled after a deploy but "no one complained"? That's a failure.
- Config-related incidents. The code was fine but the deployment broke because of a missing environment variable. Still a deployment failure.
A useful definition: any deployment that required unplanned remediation work is a failure. If an engineer had to do something they didn't expect to do because of that deployment, count it.
2. You Deploy Too Rarely
If you deploy once a month with a week of manual QA, your CFR might genuinely be low. But you're paying for it with:
- 4+ week Lead Times
- Large, risky batches when something does slip through
- Slow time-to-market for features and fixes
- Developer frustration from slow feedback loops
A low CFR achieved through infrequent deployment is not a win. It's a tradeoff — and usually a bad one.
3. You're Over-Testing in Production Environments
Some teams run extensive manual testing in staging environments that mirror production perfectly. By the time code reaches production, it's been validated extensively. CFR is low, but:
- Staging environments are expensive to maintain
- Manual testing is slow and doesn't scale
- You've shifted the cost from "occasional production failure" to "permanent testing overhead"
Why 15% Is Normal (And Healthy)
The DORA research, validated across 36,000+ professionals over a decade (Forsgren, Humble, Kim, Accelerate, 2018; annual State of DevOps Reports), consistently shows that elite teams have a CFR of 5-15%. This is not a sign of poor quality. It's a sign of:
Speed over perfection. Elite teams deploy multiple times per day. Not every deploy will be perfect. But every deploy is small, so when it fails, recovery is fast and blast radius is limited.
Real-world complexity. Production is messy. No staging environment perfectly replicates production traffic patterns, data volumes, third-party API behavior, and user interaction sequences. Some failures can only be discovered in production.
Honest measurement. Elite teams count everything. They have mature incident tracking, and they classify failures accurately. Teams with lower reported CFR often have less mature incident tracking.
Innovation velocity. Teams that ship fast are trying new things. New features, new architectures, new integrations. Some will break. That's the cost of innovation, and it's worth paying.
The Real Cost of Chasing 0%
Organizations that optimize for zero failures typically exhibit these behaviors:
| Behavior | Surface Metric | Hidden Cost |
|---|---|---|
| Week-long manual QA | Low CFR | Lead Time 4–6 weeks |
| Multiple approval gates | Low CFR | Pickup Time 3–5 days |
| Deploy freeze "just in case" | Low CFR | Deployment Frequency 1–2x/month |
| Reject risky features | Low CFR | Innovation velocity near zero |
| Under-report incidents | Low CFR | Reality disconnect, trust erosion |
The net result: the team is "safe" but slow. Product teams learn to work around engineering by hiring contractors, using no-code tools, or building features themselves. The engineering team becomes a bottleneck, not an enabler.
What to Actually Optimize
Instead of minimizing CFR, optimize the cost of each failure. This means:
1. Reduce Blast Radius
Make each failure affect fewer users for less time.
- Canary deployments: Route 1% of traffic to the new version first. If error rates spike, roll back automatically before 99% of users are affected.
- Feature flags: Ship code behind a flag. Enable for internal users first, then 10%, then 100%. A "failure" affects only the flagged segment.
- Independent service deploys: If Service A fails, Service B continues working. Microservices architecture limits blast radius.
2. Reduce Recovery Time (MTTR)
Make each failure shorter.
- One-click rollback: Any engineer should be able to roll back a deploy in under 5 minutes, without approval.
- Automated rollback triggers: If error rate exceeds threshold within 10 minutes of deploy, roll back automatically.
- Clear ownership: When an alert fires, one specific person is responsible. No "diffusion of responsibility."
3. Reduce Detection Time
Find failures faster.
- Real-time error tracking: Sentry, Datadog, or equivalent. Errors should be visible within seconds of occurring.
- Deployment-correlated alerts: "Error rate increased 300% starting 2 minutes after deploy of commit abc123." Instant diagnosis.
- Business metric monitoring: Technical metrics miss some failures. Monitor conversion rate, sign-up completion, transaction success rate.
4. Learn from Each Failure
Make each failure improve the system.
- Blameless post-mortems: Focus on "what happened" and "what do we change," not "who messed up."
- Categorize failures: Was it a code bug, a configuration error, a dependency issue, an infrastructure problem? Each category has different prevention strategies.
- Track repeat failures: If the same type of failure happens three times, it's a systemic issue that requires a systemic fix.
How to Measure Change Failure Rate Correctly
Definition Agreement
Before you start measuring, the team must agree on what counts as a failure. Recommended definition:
A deployment failure is any production deployment that results in:
- A rollback
- A hotfix deployed within 24 hours
- A service degradation visible in monitoring (error rate increase, latency increase, availability decrease)
- A customer-facing bug that requires immediate remediation
Not a deployment failure:
- A bug discovered weeks later that was introduced by that deployment (this is a product quality issue, not a deployment issue)
- A planned feature that doesn't get adopted (that's a product strategy issue)
- An infrastructure issue unrelated to the deployment (cloud provider outage during deploy window)
Calculation
$$ Change Failure Rate = (Number of failed deployments / Total deployments) x 100% $$
Measure this weekly or monthly. Single-week spikes are noise; multi-week trends are signals.
Segmentation
Track CFR by:
- Team: Identify which teams need support
- Service: Find which systems are fragile
- Day of week: Some teams see higher failure rates on Mondays (weekend changes) or Fridays (rushed before weekend)
- Deploy size: Correlate CFR with lines of code changed per deploy. This almost always shows larger deploys failing more often.
CFR Benchmarks by Industry
While the DORA report provides general benchmarks, industry context matters:
| Industry | Typical CFR | Notes |
|---|---|---|
| SaaS / Web applications | 8–15% | High deploy frequency, fast recovery |
| Fintech | 5–12% | Regulated, but mature engineering practices |
| E-commerce | 10–20% | Seasonal spikes cause stress-related failures |
| Enterprise B2B | 15–25% | Complex integrations, slower deploy cycles |
| Mobile apps | 5–10% | Can't rollback easily; more cautious deploys |
| Embedded / IoT | 3–8% | Rollback is expensive; more pre-release testing |
These ranges are consistent with data from Stack Overflow Developer Surveys and the DORA research. Your specific context matters more than industry averages.
A Framework for Reducing CFR (Without Slowing Down)
If your CFR is above 20%, here's a priority-ordered list of interventions:
Tier 1: High impact, low effort
- Add deployment-correlated error tracking (so you know immediately when a deploy causes issues)
- Implement one-click rollback
- Enforce MR size limits (under 400 lines)
Tier 2: High impact, medium effort
- Add automated smoke tests that run post-deploy
- Implement canary deployments for critical services
- Establish a blameless post-mortem process
Tier 3: High impact, high effort
- Increase test coverage for critical paths
- Decouple services for independent deployment
- Build progressive rollout infrastructure
Track CFR weekly as you implement each tier. Expect CFR to drop 5–10 percentage points per tier, with most of the improvement coming from Tier 1 (faster detection and rollback means you classify and count failures properly, and you recover before small issues become big ones).
The Relationship Between CFR and Other DORA Metrics
CFR doesn't exist in isolation. Its relationship with other metrics tells a story:
High CFR + Low Deployment Frequency = Large batches are causing failures. Fix: smaller, more frequent deploys.
High CFR + High Deployment Frequency = Insufficient testing or review. Fix: invest in CI quality gates and code review.
Low CFR + Low Deployment Frequency = Over-caution is masking quality problems. Fix: increase deployment frequency and see what surfaces.
Low CFR + High Deployment Frequency = Strong engineering maturity. Maintain and iterate.
PanDev Metrics tracks all four DORA metrics together so you can see these correlations in real time — not in a quarterly report when it's too late to act.
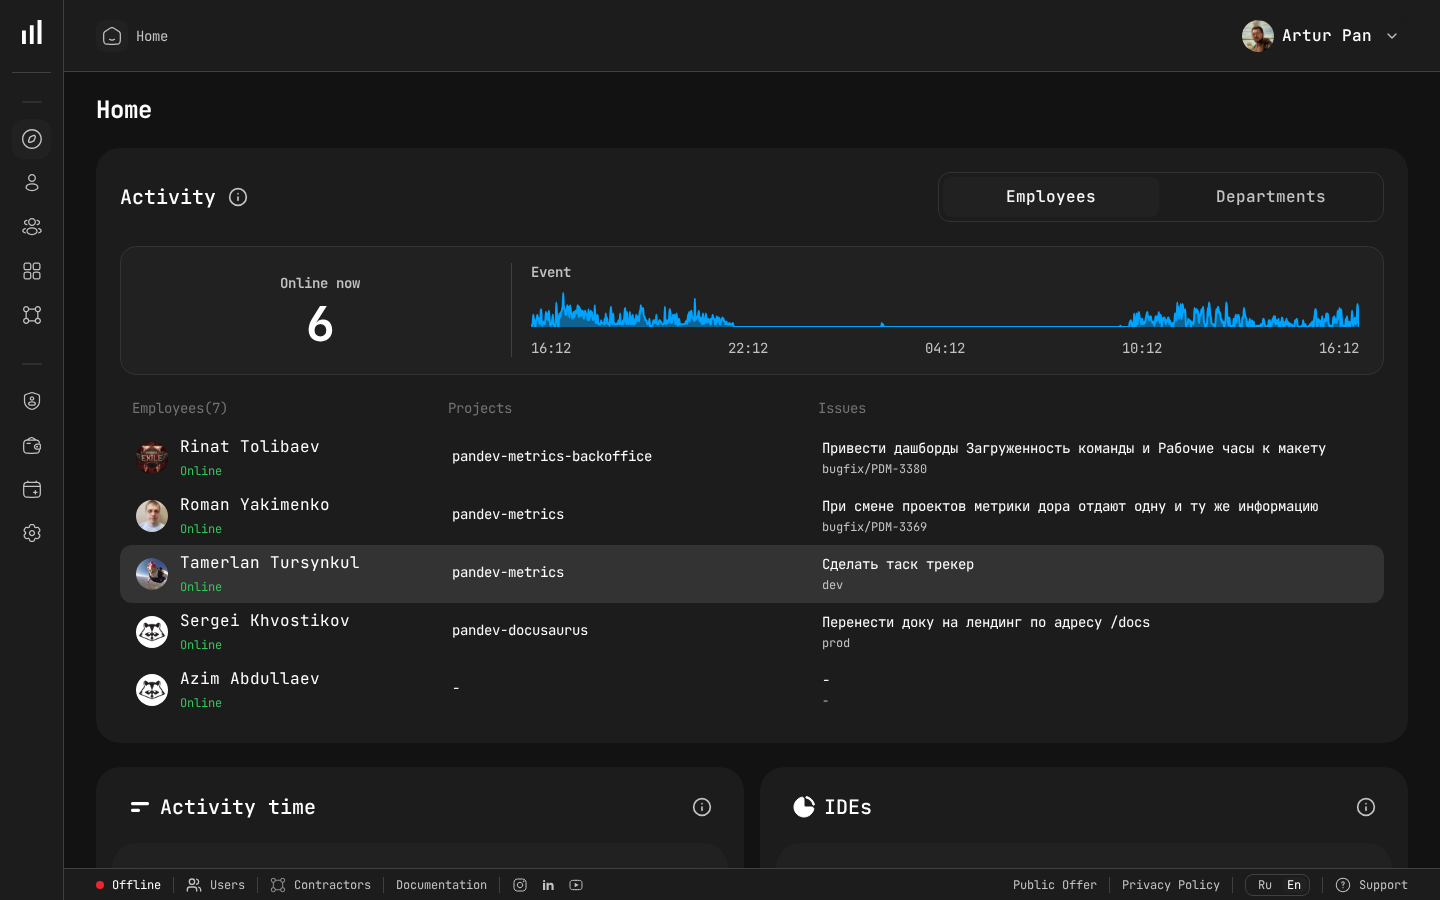
Real-time activity dashboard where deployment events and failures are tracked.
The Bottom Line
Change Failure Rate is a health metric, not a target to minimize to zero. Healthy teams fail 5–15% of the time because they're deploying frequently, measuring honestly, and recovering quickly. If your CFR is 0%, you're probably hiding failures. If it's above 25%, you need better testing and smaller batches.
The goal is not to prevent all failures. The goal is to make failures cheap, fast to detect, and fast to recover from.
Benchmarks from the DORA State of DevOps Reports (2019–2023), published by Google Cloud / DORA team.
Want to track your real Change Failure Rate — correlated with deployment events, incident data, and recovery time? PanDev Metrics calculates CFR automatically from your GitLab, GitHub, Bitbucket, or Azure DevOps pipeline data. Measure what matters →