Chrome Extension for Engineering Metrics: Track Productivity in Browser

Most engineering analytics platforms ask for a weekend before you see your first chart. OAuth into GitHub. Hook up Jira. Wait for the next deploy to backfill DORA. Convince Security to approve a webhook. Meanwhile the original question, "are we actually shipping faster after the reorg?", is two sprints stale.
A Chrome extension flips the order: install, log in, and you have signal from GitHub, GitLab, and Jira inside 30 seconds. No backend, no integrations review, no Looker license. That speed comes with sharp limits. This post covers what such an extension actually does, where it wins, and the slice of work it will never see.
{/* truncate */}
What an engineering metrics Chrome extension actually does
A browser extension lives where most non-IDE work happens. The 2023 Stack Overflow Developer Survey found 76% of developers spend at least an hour per day on web tools outside the IDE: GitHub, GitLab, Jira, Confluence, Linear, Notion, Stack Overflow itself. A content script in Chrome reads most of that signal surface without backend access.
A well-built extension captures three classes of event:
| Signal class | Examples | Useful for |
|---|---|---|
| Page-level time | Time on a specific PR, issue, board view | Code review velocity, ticket churn |
| Interaction events | PR comments, review submissions, status changes | Review load distribution, reviewer turnaround |
| Navigation patterns | Switches between repos, projects, boards | Context-switching at the platform layer |
It reads only the URL, the visible DOM, and your interaction events. No proxy server in the middle, no scraping of API tokens. Everything stays in chrome.storage.local or syncs to your own org's tenant through the extension's authenticated HTTPS call.
DORA's 2023 State of DevOps Report notes that review wait time is the single largest contributor to lead time for changes in mature teams. Review wait is exactly the in-browser interval an extension can measure directly, without webhook lag or polling delay.
Where browser extensions win over SaaS
A full Engineering Intelligence platform is the right answer when an EM team is aggregating cross-repo, cross-tenant data into board-ready dashboards. It's the wrong answer for three common cases.
Individual developer self-tracking. You want to understand your own week (review time, ticket churn, where the 4 PM Tuesday hole goes) without asking anyone for permission. An extension installs in one click and reports privately.
Small team under NDA or strict data-residency. You're at a 6-person startup that hasn't signed off on third-party SaaS handling repo metadata. An extension running locally, syncing only inside your org, buys you measurement during the months before procurement closes.
Evaluation phase. You're piloting engineering intelligence before committing to a platform. Two weeks of extension data on 3-5 developers previews what their numbers will look like, with nothing to tear down if you walk away.
Jellyfish's 2024 State of Engineering Management report showed 41% of engineering leaders cite "time to first insight" as the top selection criterion for productivity tooling, ahead of feature depth and integrations. A Chrome extension's whole pitch is collapsing that time-to-insight to a single install.
What it tracks (the concrete list)
A capable engineering-metrics extension on GitHub, GitLab, and Jira gives you, at minimum:
| Metric | Source DOM/event | Granularity |
|---|---|---|
| PR review time | Time on /pull/N/files, comment events | Per-PR, per-reviewer |
| Code review velocity | PRs reviewed per developer per day | Rolling 7-day average |
| GitHub activity heatmap | Page visits by hour × day | Per-developer |
| Jira ticket churn | Status changes observed in board view | Per-ticket, per-status |
| Repo / project switching | Navigation between distinct hosts/orgs | Daily switch count |
| Page-level dwell time | Time on each PR, issue, board | Per-URL, deduped on tab focus |
This is enough to answer a surprising number of weekly questions: who's carrying the review load?, which PRs are stuck?, am I personally jumping projects more than I should?
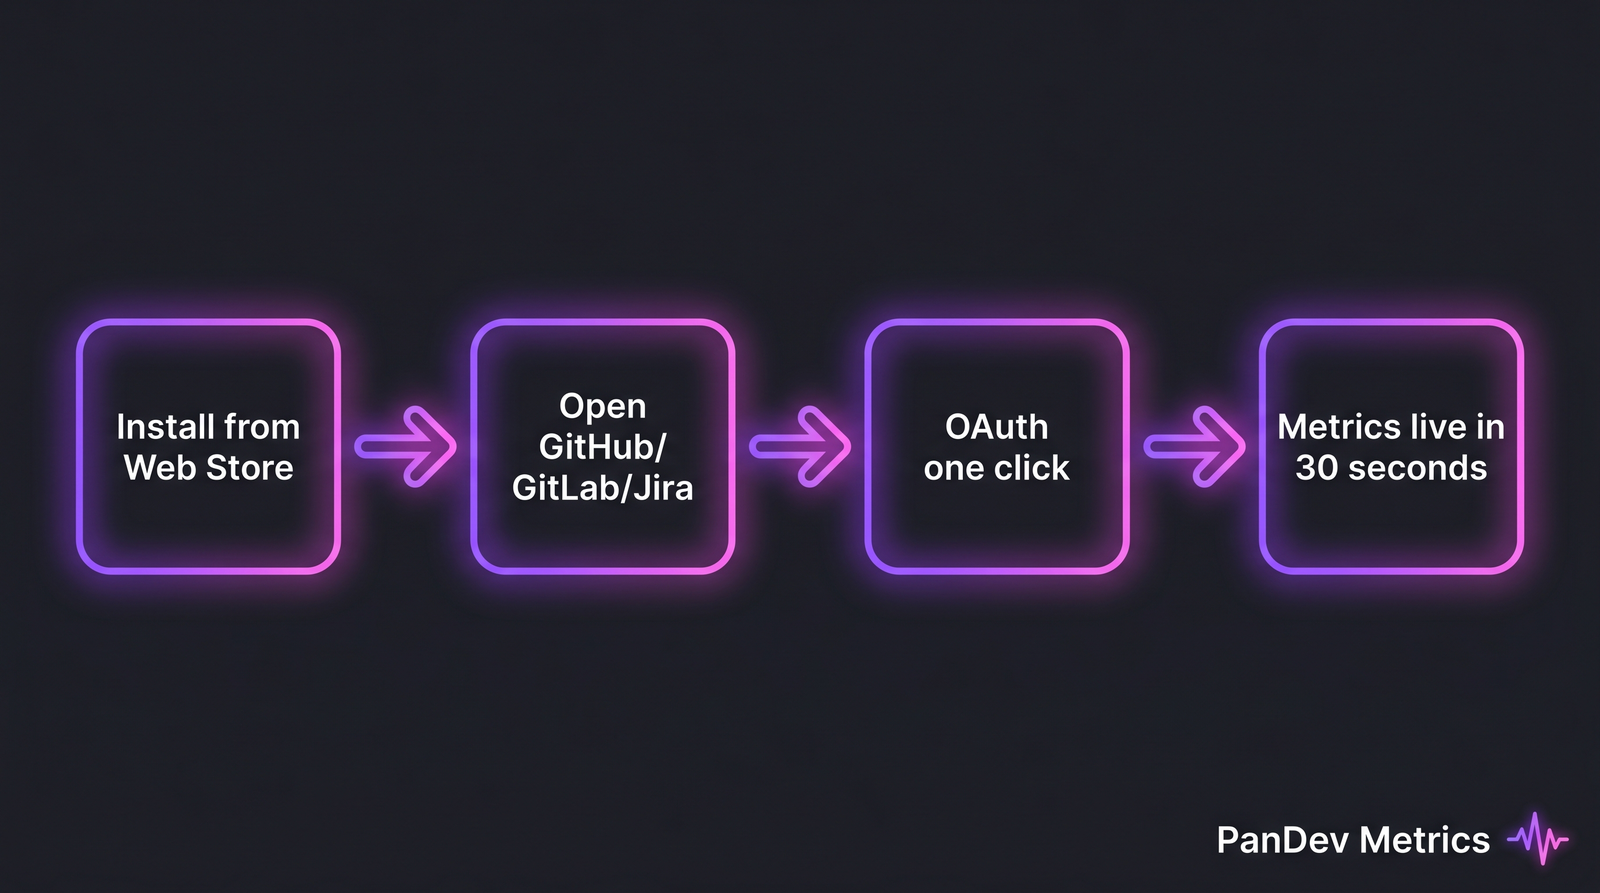 The end-to-end install flow: four stages, roughly 30 seconds from Web Store to first chart.
What it does NOT track (the privacy model)
The honest version, because a Chrome extension with the wrong permissions is genuinely scary.
A well-built engineering-metrics extension is not a keylogger. It does not capture keystrokes, clipboard, form input, or anything you type into a comment field before you submit it. The DOM events it listens for are scoped to specific selectors on specific hosts (e.g. github.com/*/pull/*, *.atlassian.net/browse/*), not the whole web.
It does not read code content. The diff view on GitHub is part of the DOM, but a metrics extension has no business sending source code anywhere. Any extension that wants webRequest or unrestricted host permissions is a red flag.
It does not transmit data outside your org's tenant. The PanDev Metrics extension, for example, syncs to whichever instance you log into: app.pandev-metrics.com for cloud users, your own on-prem hostname for self-hosted. No third-party analytics, no telemetry sidecar, no Mixpanel.
In Chrome's permission model, this lines up with three reasonable requests: activeTab for DOM access only on the page you're viewing, storage for local caching, and host permissions limited to github.com, gitlab.com, your self-hosted GitLab/Jira/Confluence domains, and the extension's own API host. Anything asking for <all_urls> for productivity tracking is overreaching. Stack Overflow's 2023 survey separately flagged 34% of developers as actively worried about extension permissions, and a minimal permission set is the first signal an extension respects that.
Setup: four steps in under 60 seconds
- Install from the Chrome Web Store. PanDev Metrics lives at chromewebstore.google.com/detail/pandev-metrics/cpecnlannccfbahifgommohpfoefhigl. One click.
- Open the popup, enter your instance URL. Cloud users use
app.pandev-metrics.com; on-prem customers enter their own hostname. The extension talks to that endpoint and nothing else. - Click "Sign in" for one-click OAuth. No copy-paste of tokens, no
chrome://flags. The extension stores a tenant-scoped JWT inchrome.storage.local. - Open any GitHub PR, GitLab MR, or Jira ticket. The popup updates with live data within a page or two of activity. The activity heatmap fills in over the first day of normal browsing.
If this takes more than a minute, you've found a bug.
Limitations: when you need the full platform
The contrarian point: an "all in a Chrome extension" engineering analytics story is an illusion of completeness. Browser extensions are self-tracking tools dressed in team-tracking aspirations. Three real gaps:
Team-wide aggregation. Aggregating across 50 developers into a CTO dashboard needs server-side joins, role-based access, tenant isolation, audit logs. None of that fits in a content script.
Cross-repo analytics by branch + task. Lead time for a feature lives across commits in 3 repos, a Jira ticket, and a deployment pipeline. The extension doesn't see the pipeline or commit metadata for repos you haven't opened. Full DORA needs a Git integration and a CI/CD webhook.
Executive dashboards. DORA quartile benchmarks, cost-per-feature, burnout signal aggregation: all depend on stitching IDE telemetry, Git, task-tracker, and deploy data together. That's a backend's job, not the browser's.
The most honest limit: a Chrome extension never sees IDE time. The SPACE framework paper in ACM Queue (Forsgren et al.) makes this explicit: measurement that ignores the editor misses the dominant block of engineering work. Our own IDE-heartbeat dataset shows the median developer codes roughly 1 hour 18 minutes per day in active sessions, often 30-50% of total work time. An extension-only setup is structurally blind to that window. For self-tracking it's fine. For team-level conclusions, it's a hole.
How the PanDev Metrics Chrome extension fits
Installed standalone, the extension is a private personal dashboard inside the browser: PR review time, GitHub activity heatmap, ticket dwell time, switch counts.
Paired with a PanDev Metrics tenant (cloud or on-prem Docker), it becomes one signal source among many. IDE plugins for JetBrains and VS Code feed coding-time heartbeats, Git integrations pull commit and PR metadata server-side, task-tracker integrations match worklogs to Jira issues, and CI webhooks complete the DORA picture. Browser activity is the thin slice of that stack that captures what happens between the IDE windows, the parts of engineering work that previously had to be self-reported.
Install from the Chrome Web Store, or read the setup docs for Chrome for the full configuration walkthrough.
FAQ
What does a Chrome extension for engineering metrics actually track? Page-level time on specific GitHub/GitLab/Jira URLs, interaction events (PR comments, review submissions, status changes), and navigation patterns between repos, projects, and boards. From those signals it builds PR review time, code review velocity, activity heatmaps, ticket churn. It does not read code, capture keystrokes, or access any tab you're not actively viewing.
Is a Chrome extension safe for engineering metrics?
A well-built one is, with two checks. It should request a minimal permission set (activeTab, storage, scoped host permissions, not <all_urls>), and it should transmit data only to your own org's tenant with no third-party analytics. Extensions asking for broad host permissions or webRequest for "productivity" features deserve a no.
Can a Chrome extension replace a SaaS engineering intelligence platform? For an individual developer or 3-5 person team during evaluation, yes. For org-wide measurement involving DORA metrics, cross-repo lead time, cost-per-feature, or burnout signal aggregation, no. Those require server-side joins, role-based access, and integrations the browser can't reach. The extension is the on-ramp, not the whole road.
How do I install the PanDev Metrics Chrome extension?
Install from chromewebstore.google.com/detail/pandev-metrics/cpecnlannccfbahifgommohpfoefhigl, open the popup, enter your instance URL (app.pandev-metrics.com or your on-prem hostname), and complete the one-click OAuth. Full notes in the Chrome extension docs.
Related reading
- DORA Metrics: The Complete Guide for 2026 for the platform-side picture once you outgrow extension-only tracking.
- Top 10 Engineering Intelligence Platforms in 2026 on where a Chrome-extension-first tool sits in the broader category.
- Developer Utilization: The Honest Metric on why browser-only data overstates utilization without IDE telemetry.
- IDE Plugins for Engineering Metrics: The Complete List, the editor-side counterpart that closes the visibility gap a browser extension can't.