Context Switching Tax: Why It Eats 40% of Engineering Time (Data)

Your senior developer is assigned to three projects. You assume they're giving each project a third of their time. Gerald Weinberg calculated the real math in Quality Software Management (1992): with three concurrent projects, each project gets about 20% of a developer's time — and the remaining 40% evaporates into context switching overhead.
This isn't speculation. It's a well-documented cognitive phenomenon, confirmed by our platform data across B2B engineering teams and consistent with Gloria Mark's research at UC Irvine showing 23 minutes of recovery time per interruption. Context switching is one of the most expensive invisible costs in software engineering.
{/* truncate */}
The Hidden Tax on Multi-Project Work
Context switching — the cognitive cost of shifting between different tasks, codebases, or mental models — is software engineering's silent productivity killer. Unlike meetings (which show up on calendars) or outages (which trigger alerts), context switching is invisible. It doesn't appear in any project management tool. It has no Jira ticket. But it consumes a substantial portion of your team's capacity.
Gerald Weinberg, in his book Quality Software Management, proposed a rule of thumb for the cost of context switching:
| Number of simultaneous projects | % time per project | % time lost to switching |
|---|---|---|
| 1 | 100% | 0% |
| 2 | 40% | 20% |
| 3 | 20% | 40% |
| 4 | 10% | 60% |
| 5 | 5% | 75% |
These numbers have been cited for decades. Microsoft Research studies on developer productivity have found similar patterns — developers working on multiple tasks simultaneously show measurably lower code quality and throughput. Let's see what actual IDE data says.
What Thousands of Hours of IDE Data Reveal
At PanDev Metrics, we track which projects developers are working on through IDE heartbeat data. When a developer switches from Project A's codebase to Project B's codebase, we see it. When they switch languages, we see that too. This gives us a ground-truth view of context switching that self-reported data can never provide.
Finding 1: The average developer touches 2.3 projects per day
Across our dataset, developers don't just work on one thing. The distribution looks like this:
| Projects per day | % of developers | Avg. daily Focus Time |
|---|---|---|
| 1 project | 31% | 92 min |
| 2 projects | 38% | 71 min |
| 3 projects | 19% | 48 min |
| 4+ projects | 12% | 29 min |
The correlation is stark: developers working on a single project per day achieve 3.2x more Focus Time than those juggling four or more projects. And this isn't because single-project developers are more senior or more talented — it's because context switching is destroying the multi-project developers' ability to enter and maintain flow state.
Finding 2: Each project switch costs 15-25 minutes
When we analyze the gap between switching away from one project and reaching sustained coding activity in a new project, the average ramp-up time is significant:
| Switch type | Avg. ramp-up time | Focus session quality after switch |
|---|---|---|
| Same language, related project | 12 min | Good — shared mental models help |
| Same language, unrelated project | 18 min | Medium — different architecture to load |
| Different language, related domain | 22 min | Medium-low — syntax + domain switch |
| Different language, unrelated project | 28 min | Low — full context reload required |
Our top three languages — Java (2,107 hours), TypeScript (1,627 hours), and Python (1,350 hours) — are often used by the same developers across different projects. A developer switching from a Java backend to a TypeScript frontend within the same product incurs less overhead than one switching between completely unrelated codebases.
Finding 3: Tuesday's productivity peak correlates with lower switching
Tuesday is the peak coding day in our data. It also shows the lowest context-switching rate of any weekday:
| Day | Avg. project switches per developer | Avg. Focus Time | Relative productivity |
|---|---|---|---|
| Monday | 3.2 | 68 min | Medium |
| Tuesday | 2.1 | 89 min | High |
| Wednesday | 2.5 | 79 min | Medium-High |
| Thursday | 2.8 | 74 min | Medium |
| Friday | 3.0 | 62 min | Medium-Low |
Monday has the most context switching (catching up after the weekend, sprint planning distributes work across projects). Tuesday benefits from Monday's coordination — developers know what to focus on and can commit to a single project for longer stretches.
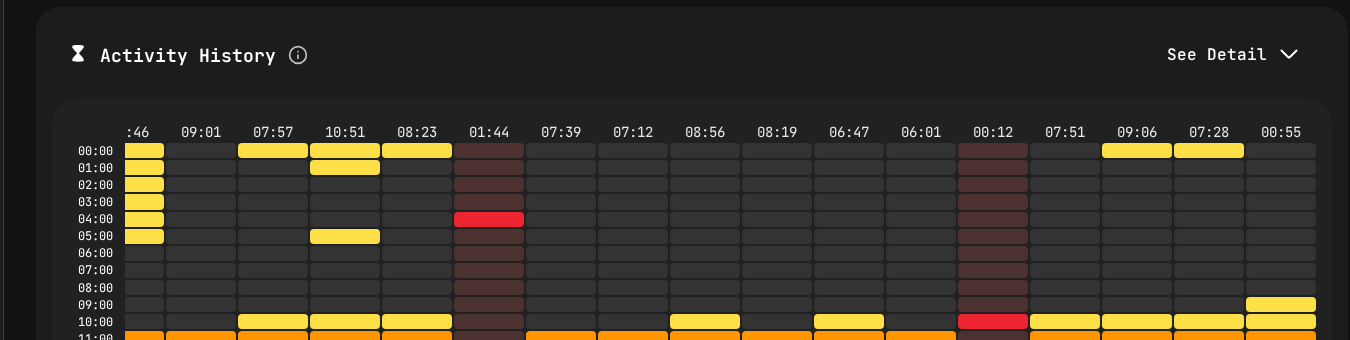 Activity heatmap from PanDev Metrics — fragmented yellow blocks across multiple projects reveal the real cost of context switching throughout the day.
The Five Types of Context Switches
Not all context switches are equal. Understanding the taxonomy helps you identify which ones to eliminate:
Type 1: Project switching (highest cost)
Switching between entirely different codebases. This requires unloading one mental model (architecture, data flow, naming conventions, tech stack) and loading another. Cost: 20-30 minutes per switch.
Type 2: Language switching (high cost)
Moving between programming languages. Our data shows developers commonly switch between Java and TypeScript, or Python and TypeScript, within the same day. Even experienced polyglots lose time to syntax mode switching. Cost: 15-25 minutes.
Type 3: Task switching within a project (medium cost)
Switching from feature work to bug fixing within the same codebase. The project context stays loaded, but the specific code area changes. Cost: 10-15 minutes.
Type 4: Tool switching (low-medium cost)
Moving between IDE, browser, Slack, Jira, and terminal. Modern development requires constant tool switching, but it's lower cost because the mental model stays active. Cost: 5-10 minutes.
Type 5: Interruption-driven switching (variable cost)
Someone asks a question on Slack. A PR review request arrives. A meeting starts in 5 minutes. These are the most damaging because they're unplanned — the developer didn't choose to switch, so there's no natural stopping point in their current work. Cost: 15-30 minutes (aligns with Gloria Mark's interruption research).
The Mathematics of Destruction
Let's quantify the cost for a typical engineering team.
Scenario: 8-person team, average multi-project load
| Parameter | Value |
|---|---|
| Team size | 8 developers |
| Avg. projects per developer | 2.3 |
| Avg. project switches per day | 2.8 |
| Avg. cost per switch | 20 min |
| Total daily switching cost | 56 min per developer |
| Team daily switching cost | 7.5 hours |
| Monthly team switching cost | 150 hours |
That's 150 hours per month — nearly a full developer's monthly output — lost to context switching overhead. Not to meetings. Not to bugs. Just to the cognitive tax of switching between projects.
Comparison to median coding time
Our median developer codes 78 minutes per day — consistent with McKinsey's 2023 finding that developers spend only 25-30% of their time writing code. If 56 minutes are lost daily to context switching, the developer is spending 42% of their total available coding time just ramping back up after switches. That means less than half of their coding effort is in sustained, productive flow. Cal Newport's Deep Work framework would classify this as entirely shallow work — never reaching the concentrated state where complex problem-solving happens.
| Time allocation | Minutes per day |
|---|---|
| Available work time (excl. meetings) | ~360 min |
| Non-coding work (email, Slack, reviews) | ~225 min |
| Actual coding time | 78 min (median) |
| Of which: context switching overhead | ~33 min |
| Sustained productive coding | ~45 min |
Forty-five minutes of sustained, productive coding per day. That's what many developers are left with after meetings, communication, and context switching take their share.
Strategies to Reduce Context Switching
Strategy 1: Project days, not project hours
Instead of splitting each day across multiple projects, assign developers to one project per day (or ideally, multi-day blocks).
| Approach | Switches per week | Weekly Focus Time per developer |
|---|---|---|
| Daily multi-project (current) | 14 | 5.9 hours |
| Half-day blocks | 10 | 6.8 hours |
| Full-day blocks | 5 | 8.2 hours |
| Multi-day blocks (2-3 days) | 2-3 | 9.1 hours |
Multi-day project blocks reduce switching by 80% and increase weekly Focus Time by 54% compared to daily multi-project work.
Strategy 2: Reduce simultaneous project assignments
The most effective change is the simplest: assign fewer concurrent projects.
| Projects per developer | Management convenience | Developer productivity |
|---|---|---|
| 1 | Low (requires more devs) | Maximum |
| 2 | Medium | Good (20% loss) |
| 3 | High | Poor (40% loss) |
| 4+ | Maximum | Terrible (60%+ loss) |
Engineering managers often assign developers to multiple projects because they believe it maximizes utilization. The data shows it does the opposite — it maximizes the appearance of utilization while destroying actual output. A developer assigned to three projects looks busy on all three but delivers less total work than if they focused on one at a time.
Strategy 3: Group related work
If multi-project work is unavoidable, minimize the cognitive distance between projects:
- Same language, related domain → lowest switching cost
- Frontend + backend of same product → medium cost
- Completely unrelated codebases → highest cost
When you must split a developer across projects, choose projects that share context: same tech stack, same domain, ideally same codebase repository.
Strategy 4: Buffer meetings as switch boundaries
If a developer must switch projects, schedule the switch around natural breaks — lunch, end of day, or after a meeting. Switching mid-flow is far more expensive than switching at a natural stopping point.
| Switch timing | Context loss | Ramp-up time |
|---|---|---|
| Mid-flow (interrupted) | High | 25-30 min |
| At natural break | Medium | 15-20 min |
| After a meeting/lunch | Low | 10-15 min |
| Start of day (new project) | Minimal | 5-10 min |
Strategy 5: Measure and make visible
You can't manage what you can't see. PanDev Metrics tracks project switches automatically through IDE data — no self-reporting needed. When the data is visible on team dashboards, both managers and developers become aware of switching costs and naturally start reducing them.
The cost per project feature in PanDev Metrics helps quantify the true cost of splitting developer attention. When a manager can see that assigning Developer A to three projects costs 40% of their productive time, the decision to consolidate becomes obvious.
The Organizational Challenge
Reducing context switching isn't just an engineering decision — it's an organizational one. Product managers want "their" developer available on "their" project every day. Stakeholders want immediate responsiveness. Company culture often rewards visible busyness over actual output.
Making the case to leadership
| Argument | Data point |
|---|---|
| "Multi-project work wastes capacity" | 150 hours/month lost for an 8-person team |
| "Single-project focus is faster" | 3.2x more Focus Time for single-project developers |
| "It's cheaper than hiring" | Reducing from 3 projects to 1 per developer is equivalent to adding 40% more engineers |
| "Tuesday proves it" | Our highest-productivity day is also our lowest-switching day |
The utilization trap
The instinct to "fully utilize" every developer by assigning them to multiple projects comes from manufacturing thinking. In manufacturing, an idle machine is wasted capacity. In knowledge work, idle time is thinking time — and thinking is where design decisions, debugging insights, and architectural clarity happen. Brooks made this point in The Mythical Man-Month: software development is a creative, design-heavy activity, not an assembly line.
A developer staring at the ceiling for 15 minutes might be solving a problem that saves three days of implementation time. A developer "fully utilized" across four projects never has those 15 minutes.
How PanDev Metrics Helps
PanDev Metrics provides several tools specifically designed to identify and reduce context switching:
| Feature | How it helps |
|---|---|
| Activity Time by project | Shows exactly how time is distributed across projects |
| Focus Time tracking | Reveals whether developers achieve sustained coding sessions |
| Cost per project | Calculates the true cost (including switching overhead) of each project |
| Gamification (XP/levels) | Rewards sustained focus, not just total activity |
| Productivity Score | Composite metric that penalizes high-variance, fragmented patterns |
The gamification system is particularly relevant: developers earn more XP for sustained focus sessions than for fragmented activity. This creates positive incentive alignment — developers naturally protect their focus because it's visible and rewarded.
Action Plan for Engineering Managers
-
Audit project assignments this week. List every developer and how many projects they're assigned to. If anyone has 3+, flag it.
-
Implement project-day scheduling. Start with your most senior developers first — they have the most complex context to switch and the highest cost of lost productivity.
-
Track context switching for one month. Use IDE-level data to establish your baseline switching rate and Focus Time.
-
Present the cost to leadership. Use the math: developer count × switches per day × 20 minutes × working days = monthly hours lost. Convert to dollars.
-
Set a team target. Aim for an average of 1.5 projects per developer per day or less. Monitor weekly.
Context switching is the invisible tax on every multi-project engineering team. The data is clear: reducing it is the highest-leverage productivity improvement most teams can make.
Based on aggregated data from PanDev Metrics Cloud (April 2026), thousands of hours of IDE activity across B2B engineering teams. References: Gerald Weinberg, "Quality Software Management: Systems Thinking" (1992); Gloria Mark, "The Cost of Interrupted Work" (UC Irvine, 2008); Cal Newport, "Deep Work" (2016); Fred Brooks, "The Mythical Man-Month" (1975); McKinsey developer productivity report (2023).
Want to see your team's context switching cost? PanDev Metrics tracks project switches, Focus Time, and cost per project — giving you the data to eliminate your team's biggest invisible productivity drain.