Cost of Delay: What Each Week of Slipping a Feature Actually Costs

A feature is two weeks late. The product manager shrugs: "It's still in the same quarter." The engineering lead nods. The CFO never hears about it. Two weeks turn into six. By then, the enterprise customer who needed it for their procurement cycle has signed with a competitor. The total business cost of that slip was roughly $192,000. None of it appears on any engineering report.
Cost of Delay (CoD) is the most-talked-about, least-quantified concept in modern product development. Don Reinertsen built the math in The Principles of Product Development Flow (2009, chapter 2), and SAFe formalized it into WSJF (Weighted Shortest Job First). McKinsey's 2023 Developer Velocity research found that B2B SaaS leaders ship features 4–5x faster than laggards and capture disproportionately more pipeline ARR per engineer. Yet ask 10 product managers what their last delayed feature actually cost the business and 9 will say "I don't know." The math is reachable. Most teams just never reach for it.
{/* truncate */}
Why Cost of Delay is rarely calculated
Three reasons, in descending order of how easy they are to fix:
1. The data lives in three different teams. Lost ARR sits with sales. Dev cost sits with engineering finance. Opportunity cost sits in the product roadmap. No single person owns the join.
2. Engineering doesn't track per-feature cost. Without a credible "this feature cost us $42K so far," the dev-cost component of CoD is a guess. We covered the SQL-grade method in Cost per Feature: The SQL Formula That Actually Reconciles. Until that's solved, CoD is structurally fuzzy.
3. Revenue attribution to specific features is hard. Sales rarely agrees that a deal closed because of feature X. They prefer "the relationship" or "executive sponsorship." This is the single biggest blocker.
The teams that overcome this are usually the ones with a strong product-marketing function plus an engineering-finance discipline. PanDev Metrics solves the second piece (per-feature cost tracking from IDE telemetry), but it can't solve the first or third for you.
The Cost of Delay formula
Reinertsen's canonical breakdown, restated for B2B SaaS:
CoD per week = (lost revenue per week) + (continued dev cost per week) + (opportunity cost per week)
Three components, each with its own measurement path:
Lost revenue per week. What ARR or pipeline does this feature unlock, and over what window? If the feature unlocks $480K ARR but the customer signs whenever it's ready, the lost-revenue component is small (you don't lose ARR, you defer it by a month). If there's a hard procurement window (Q2 enterprise deal cycle, regulatory deadline, competitor RFP), every week of delay risks the entire opportunity.
Continued dev cost per week. What is the engineering team burning while the feature is in flight? This is your fully loaded weekly cost. Not just the developer's salary, but the overhead-coefficient-adjusted loaded rate covering management, DevOps, and shared services. Two engineers at $46/hr loaded × 40 hrs × 2 weeks = $7,360 of pure burn even if the feature is shipping nothing.
Opportunity cost per week. What is the next feature on the backlog worth, and what does each week of delay cost that feature? This is where most teams stop because the math feels recursive. The shortcut: estimate the next feature's CoD and divide by some fraction (we use 0.5, half-credit for the queued feature).
The full picture is a three-layer stack. The illustration below shows how the three components add up across four typical feature archetypes.
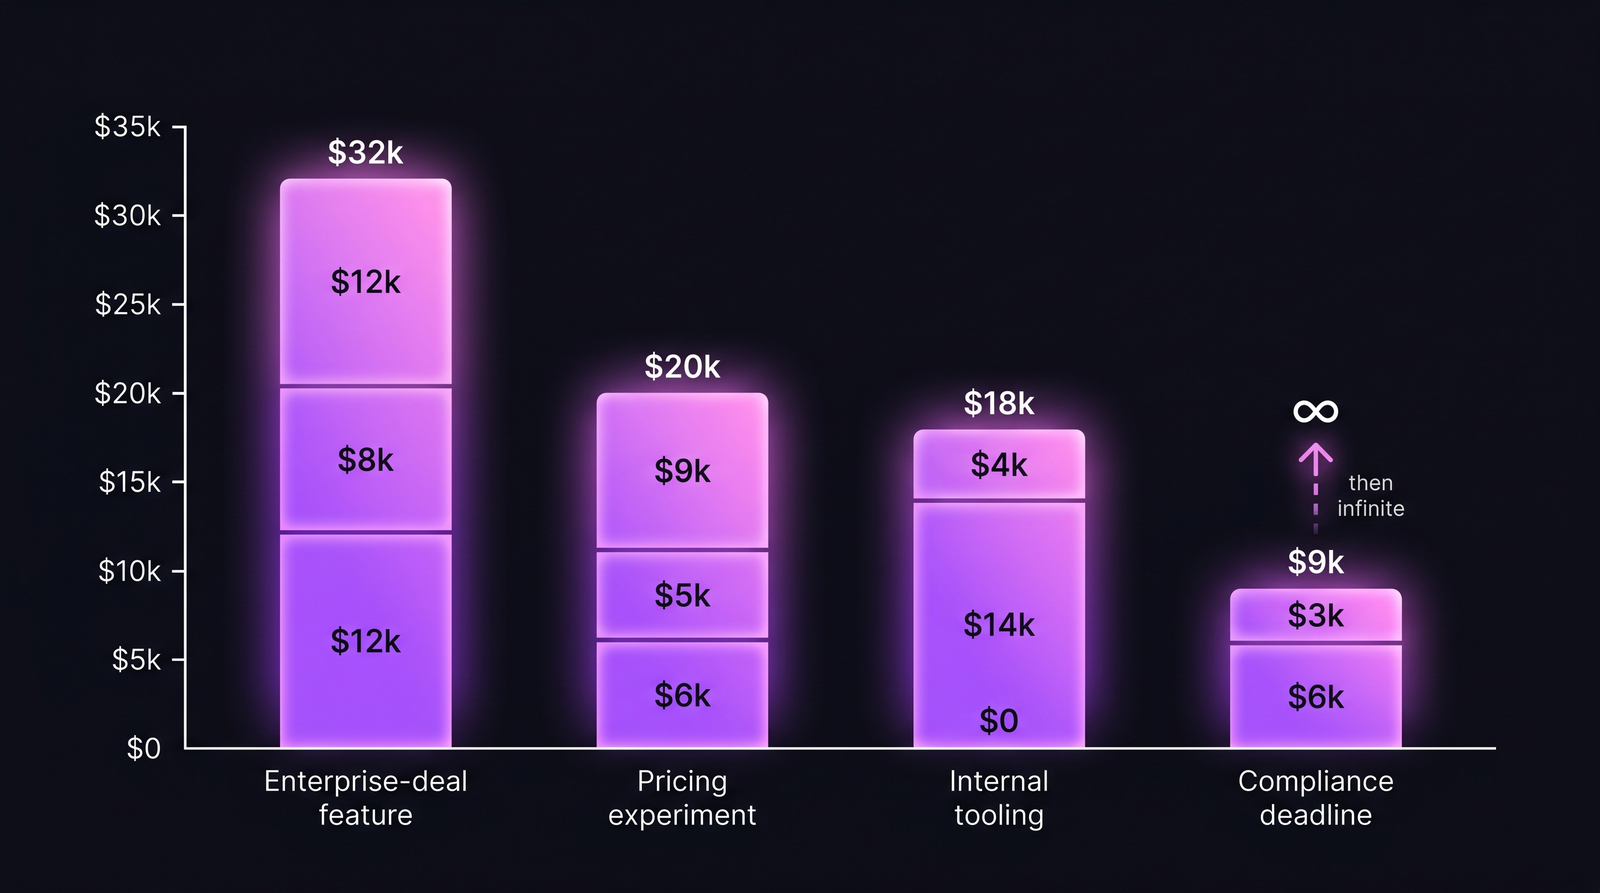 Stacked CoD per week. The dev-cost bar is roughly constant; what swings the total is lost revenue and opportunity cost.
Three worked scenarios where CoD changes the decision
Scenario 1 — B2B SaaS feature blocking an enterprise deal
The deal is real, the ARR is committed in writing pending the feature, the procurement window is Q2 (closes in 6 weeks).
| Component | Per week | How we got it |
|---|---|---|
| Lost ARR (deal at risk) | $12,000 | $480K ARR × ~2.5% per-week deal-loss probability |
| Continued dev cost | $8,000 | 2 engineers × $46/hr loaded × 40 hrs + ~30% PM/QA overhead |
| Opportunity cost | $12,000 | Next feature CoD ≈ $24K/wk × 0.5 |
| Total CoD/week | $32,000 |
A 4-week slip costs the business roughly $128,000. A 6-week slip past the procurement window risks the full $480K ARR plus another $48K in opportunity cost. That's a swing of well over half a million dollars. This is the scenario where every standup that loses a day to context-switching has a real, computable price tag.
Scenario 2 — Internal tooling improvement
A new internal dashboard for the customer-success team. No direct revenue. The pitch is "saves CS team 4 hours/week."
| Component | Per week | How we got it |
|---|---|---|
| Lost revenue | $0 | No revenue attribution |
| Continued dev cost | $14,000 | 3 engineers × $46/hr × 40 hrs + DevOps + PM time |
| Opportunity cost | $4,000 | Next feature has weak CoD |
| Total CoD/week | $18,000 |
The math says: this feature has to save the CS team more than $18,000/week in labor (over 200 CS hours/week at a $80/hr loaded CS rate), or the team should deprioritize it and ship the next revenue-attached feature first. The 4-hour-per-CS-week pitch yields maybe $2K/week in saved time. The feature is upside-down by an order of magnitude. It still might be worth shipping for morale or strategic reasons, but the financial case is negative.
This is the scenario where CoD changes the decision. Without the math, "small internal tool" sounds cheap. With the math, it's the most expensive thing on the backlog.
Scenario 3 — Compliance feature with a regulatory deadline
A SOC 2 audit-trail feature. Auditors arrive June 15. Without the feature, the company fails the audit and loses three enterprise deals contingent on SOC 2 compliance.
| Component | Per week | How we got it |
|---|---|---|
| Lost revenue (pre-deadline) | $0 | No revenue lost while there's still time to ship |
| Continued dev cost | $6,000 | 1 engineer + part-time security review |
| Opportunity cost | $3,000 | Lower priority queued |
| Total CoD/week (pre-deadline) | $9,000 | |
| Total CoD (post-deadline) | infinite | Audit fail, deal loss, reputational damage |
CoD is non-linear here. It looks deceptively cheap until the deadline, then becomes catastrophic. The right read: this feature is P0 from day 1, even though the per-week CoD is the lowest of the three scenarios. The CoD framework correctly handles deadline-driven work by flagging the discontinuity, not by ranking it on a steady-state per-week number.
How CoD changes WSJF prioritization
The most useful application of CoD is in backlog ranking. SAFe's WSJF formula is:
WSJF = Cost of Delay / Job Size
Higher WSJF = ship sooner. The contrarian point: value/effort ranking and CoD/effort ranking often disagree, and CoD is right.
Worked example: 5 features in a Q2 backlog, ranked two ways.
| Feature | Effort (wk) | Value ($K) | CoD/wk ($K) | Naive value/effort | WSJF (CoD/effort) |
|---|---|---|---|---|---|
| A — Enterprise integration | 6 | 200 | 32 | 33.3 | 5.33 |
| B — Pricing page experiment | 1 | 40 | 20 | 40.0 | 20.0 |
| C — Internal CS dashboard | 4 | 60 | 18 | 15.0 | 4.50 |
| D — SOC 2 audit trail | 3 | "infinite" | 9 (then ∞) | n/a | ∞ at deadline |
| E — Mobile push notifications | 5 | 80 | 12 | 16.0 | 2.40 |
Naive value/effort puts B (pricing experiment) first, then A. WSJF puts D (compliance) first because of the deadline cliff, then B (cheap, fast, decent CoD), then A. C (internal tooling) drops to the bottom of the priority list. That's exactly the inversion CoD was designed to surface. Most teams ship C anyway because the CS team complained loudest in last week's standup. The math says ship E or A first.
Bain & Company's 2024 product-management benchmarking survey found that B2B SaaS teams using formal CoD or WSJF prioritization ship 28% more revenue-attached features per quarter than teams using "stack-rank by exec opinion." The mechanism is exactly this kind of inversion: routinely deprioritizing features with hidden weak business cases.
Tracking CoD trajectory in real time
CoD is most useful as a running metric, not a one-time estimate at backlog grooming. Two questions matter day-to-day:
- Are we burning the dev-cost component faster than planned? If a 2-week feature is in week 3, the continued-dev-cost component has doubled and the lost-revenue component is rolling.
- Is the opportunity cost growing because the next feature is becoming time-critical? This is the silent killer. The feature you're shipping is fine; the one you're not shipping is the one bleeding money.
PanDev Metrics surfaces the first question through the Task Costs Dynamic Widget, which plots cost trajectory of an in-progress feature day-by-day from IDE-tracked time. The endpoint GET /departments/{id}/finance/employees/{userId}/task-costs returns historical per-task cost progression so finance teams can join it with sales pipeline data and compute live CoD without rebuilding the join in a spreadsheet. Period filters (last30Days, last60Days, last90Days, last180Days, allTime) let you track long-running features whose CoD compounds over months. This gets more useful when paired with task-level cost tracking via your issue tracker, which we covered separately.
The trajectory view also surfaces the burn vs progress mismatch, when cumulative cost is at 80% of estimate but completion is only at 50%. That gap is the leading indicator of a slip, not the daily-standup status report.
What our data can't tell you
Cost of Delay requires credible revenue attribution. If your finance team can't tell you "this feature unlocks $X of pipeline ARR," you'll be guessing on the biggest variable in the formula. PanDev Metrics gives you the dev-cost component to within a few percent: engineer time × loaded rate is precisely measurable. We give you nothing on the lost-revenue side. That number has to come from a working sales-finance pipeline, ideally with each opportunity tagged to the specific feature dependency.
A pragmatic adoption path: start with internal tooling features where dev cost and time-saved are both measurable, even if revenue attribution is zero. The CoD math for those is honest and self-contained. Once the team is comfortable with the formula, graduate to revenue-attributed features by working with sales to tag deal dependencies. Don't try to do both at once. The revenue-attribution conversation alone takes a quarter to land.
Common mistakes when introducing CoD
- Treating CoD as a one-time estimate at planning. Real CoD is a running number. Re-estimate weekly for in-flight features.
- Inflating the lost-revenue component. Sales will tell you every deal is "at risk." Use a per-week probability, not a binary "we'll lose it."
- Ignoring the opportunity cost. This is the component most teams skip. It's the reason internal tooling looks cheaper than it is.
- Applying WSJF without adjusting for compliance/deadline cliffs. The formula works for steady-state features. Deadline-driven work needs a separate "P0 by date X" lane.
- Letting engineering own the formula alone. CoD is a finance + sales + product + engineering math. If only one team owns it, the other three components will be wrong.
How to start in 30 days
Week 1: Pick the next 5 features in your backlog. For each, estimate effort in weeks and rough dev cost using your loaded hourly rate.
Week 2: Walk through each with sales/CS. For revenue-attached features, get a per-week probability of deal loss if delayed. For internal features, estimate weekly time saved × loaded rate of the saving team.
Week 3: Compute CoD per week and WSJF for each feature. Rank. Compare against the current order. Note the inversions.
Week 4: Reorder the backlog. Ship the highest-WSJF feature first. Track actual elapsed time vs planned. Re-compute CoD weekly.
The goal isn't to convert every prioritization meeting into a spreadsheet. It's to build the muscle for catching the cases where the obvious priority is the expensive priority.
Related reading
- Cost per Feature: The SQL Formula That Actually Reconciles: the per-feature cost number CoD depends on
- Cost per Task: Issue Tracker Integration That Actually Adds Up: task-level cost progression
- Lead Time for Changes: 4-Stage Breakdown: measure the actual delay you're costing
- Loaded Hourly Rate: Why Your Engineer Costs 50% More Than Their Salary: the dev-cost input to CoD
- Engineering ROI: Treating R&D as Investment, Not Expense: the framework CoD plugs into
The teams that take CoD seriously aren't the ones with the fanciest spreadsheets. They're the ones who, when a feature slips a week, can name the dollar number out loud — and decide what to do with it.