How Much Does Your Feature Cost? Calculating Cost Per Feature

Your product team just shipped a new reporting dashboard. It took three sprints, involved four developers, a designer, and a QA engineer. How much did it actually cost?
If your answer is "I don't know" or "somewhere between $20K and $80K," you're not alone. Most engineering organizations cannot answer this question with any precision. According to Stripe's Developer Coefficient report, companies collectively spend over $300 billion annually on developer time — yet few can attribute those costs to individual features. That disconnect turns every product decision into a guess.
{/* truncate */}
Why Cost Per Feature Matters
Every quarter, product and engineering leaders sit in planning meetings making decisions about what to build next. These decisions involve tradeoffs: build Feature A or Feature B? Invest in tech debt reduction or new functionality? Hire two more developers or outsource?
Without knowing how much features actually cost, these decisions are made on gut feeling. With cost-per-feature data, they become investment decisions backed by numbers.
Who benefits from cost-per-feature tracking:
- CPOs and Product Managers — prioritize features based on ROI, not just user requests
- CFOs — forecast engineering spend with accuracy, tie development costs to business outcomes
- CTOs and VPs of Engineering — justify headcount, identify cost overruns early, benchmark team efficiency
- CEOs — understand where the engineering budget actually goes
The Formula: Breaking Down Cost Per Feature
At its simplest, the cost of a feature is:
Cost Per Feature = Σ (Hours_per_developer × Hourly_rate_per_developer) + Infrastructure + Overhead
But "simple" doesn't mean "easy." Let's break this down into components.
Component 1: Direct Labor Cost
This is where most of the money goes — typically 70-85% of total feature cost.
Direct Labor Cost = Σ (Hours_developer_i × Rate_developer_i)
Example:
| Team Member | Role | Hours | Hourly Rate | Cost |
|---|---|---|---|---|
| Alex | Senior Backend Dev | 120h | $85/h | $10,200 |
| Maria | Frontend Dev | 80h | $65/h | $5,200 |
| James | QA Engineer | 40h | $55/h | $2,200 |
| Sarah | Designer | 24h | $60/h | $1,440 |
| Total | 264h | $19,040 |
Component 2: Overhead Multiplier
Developers don't spend 100% of their time coding features. They attend meetings, do code reviews, mentor juniors, and handle on-call duties. A typical overhead multiplier is 1.3x to 1.6x.
Effective Cost = Direct Labor Cost × Overhead Multiplier
For our example: $19,040 × 1.4 = $26,656
Component 3: Infrastructure and Tooling
This includes CI/CD costs, cloud resources for development and staging environments, and tooling licenses. For most teams, this adds 5-15% on top of labor costs.
Total Feature Cost = Effective Cost × (1 + Infrastructure_Rate)
For our example: $26,656 × 1.10 = $29,322
The Complete Formula
Total Cost = Σ(Hours_i × Rate_i) × Overhead_Multiplier × (1 + Infra_Rate)
Where Traditional Tracking Falls Apart
The formula is straightforward. The hard part is getting accurate hours per developer per feature. Here's where most organizations fail:
Problem 1: Self-Reported Time Is Inaccurate
Self-reported time tracking consistently shows a 20-40% error margin. Developers round up, forget to log, or batch-report at the end of the week. McKinsey's research on engineering productivity confirms that most organizations lack reliable data on how engineering time is actually spent. If your cost calculation relies on Jira time logs, your numbers could be off by thousands of dollars per feature.
Problem 2: Context Switching Is Invisible
A developer might be assigned to Feature A but spend 30% of their time on bug fixes for Feature B. Sprint boards don't capture this — they show assignment, not actual effort.
Problem 3: Non-Coding Work Gets Lost
Code reviews, architecture discussions, debugging, and deployment work are rarely tracked at the feature level. Yet they can account for 30-50% of the total effort.
Problem 4: Different Rates, Same Bucket
When a senior architect ($120/h) and a junior developer ($45/h) both log 40 hours on a feature, the cost difference is $3,000. Flat "developer hour" calculations miss this entirely.
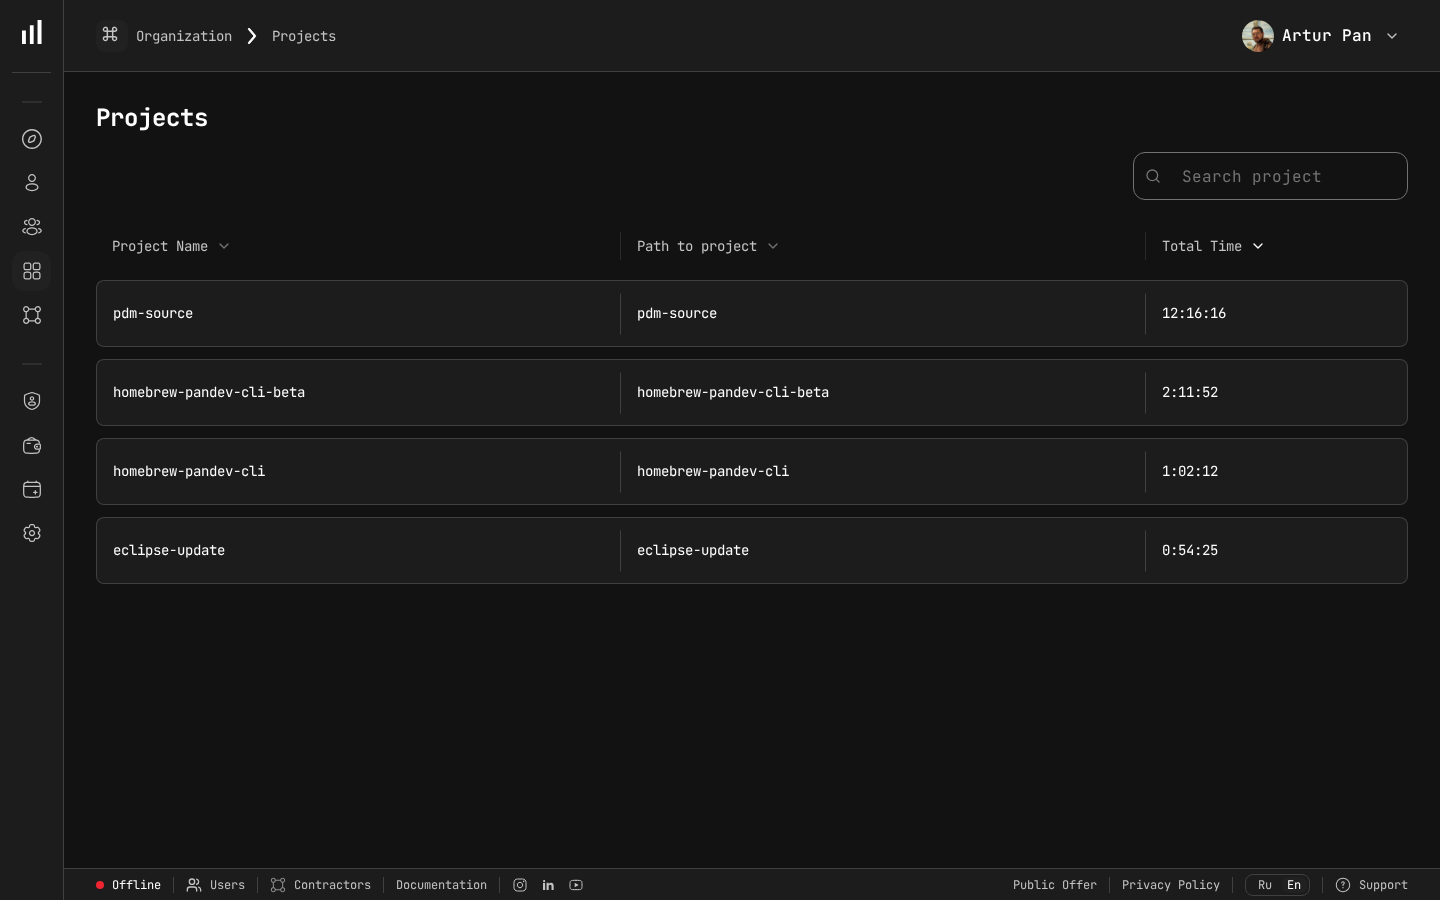 The Projects view aggregates tracked time and cost per project — the foundation for calculating accurate cost per feature.
Automated Cost Tracking: A Better Approach
The solution is to combine automated activity tracking with financial data. Here's the methodology:
Step 1: Track Actual Coding Time Per Developer
IDE plugins can capture exactly how much time each developer spends writing, reviewing, and debugging code — tied to specific branches, repositories, and projects. No manual logging required.
Step 2: Map Activity to Features
By linking Git branches and commits to project identifiers (Jira tickets, Linear issues, etc.), you can automatically attribute coding time to specific features.
Step 3: Apply Individual Hourly Rates
Each developer has a different cost. Applying individual hourly rates (or at minimum, role-based rates) produces accurate cost figures instead of averages.
Step 4: Calculate in Real Time
Don't wait until a feature ships to discover it cost 3x the estimate. Track costs as they accumulate so you can course-correct mid-sprint.
Real-World Example: The $47K Login Redesign
Let's walk through a realistic scenario. A mid-size SaaS company decides to redesign their login flow. The product manager estimates it at "2-3 weeks, maybe 2 developers."
What actually happened:
| Phase | Who | Actual Hours | Rate | Cost |
|---|---|---|---|---|
| Initial implementation | Senior Frontend Dev | 96h | $80/h | $7,680 |
| Backend auth changes | Backend Dev | 64h | $75/h | $4,800 |
| OAuth integration issues | Senior Backend Dev | 48h | $90/h | $4,320 |
| QA and bug fixes | QA Engineer | 56h | $55/h | $3,080 |
| Design iterations | UX Designer | 32h | $65/h | $2,080 |
| Code reviews | 3 developers | 24h | $80/h avg | $1,920 |
| Deployment and monitoring | DevOps Engineer | 16h | $85/h | $1,360 |
| Subtotal | 336h | $25,240 | ||
| Overhead (1.4x) | $10,096 | |||
| Infrastructure (10%) | $2,524 | |||
| Total | $37,860 |
The original estimate? "Maybe $15-20K." The actual cost was nearly double. The OAuth integration alone — an unplanned scope expansion — added $4,320.
Without automated tracking, this company would have never known the true cost. The next time a similar feature comes up, the estimate would still be wrong.
Using Cost Per Feature Data for Better Decisions
Once you have accurate cost data, you can make dramatically better product decisions.
Prioritization by ROI
Instead of prioritizing features by "customer demand" alone, you can calculate expected ROI:
Feature ROI = (Expected Annual Revenue Impact - Feature Cost) / Feature Cost × 100%
| Feature | Est. Revenue Impact | Est. Cost | ROI |
|---|---|---|---|
| Advanced reporting | $200K/year | $45K | 344% |
| Mobile app | $150K/year | $120K | 25% |
| SSO integration | $300K/year | $25K | 1100% |
SSO integration wins — not because it generates the most revenue, but because it has the best return on engineering investment.
Historical Benchmarking
Over time, cost-per-feature data reveals patterns:
- "Authentication features cost us 2.1x the initial estimate on average"
- "Team Alpha delivers features at $180/point; Team Beta at $240/point"
- "Features involving our legacy billing system cost 40% more than the platform average"
These insights feed directly into better estimation and planning.
Budget Forecasting
With 6-12 months of cost data, CFOs can forecast engineering spend for the next quarter with significantly higher accuracy:
Forecasted Spend = Σ (Planned_Features × Historical_Cost_Per_Feature_Type) + Buffer
Getting Started: A Practical Roadmap
If you're starting from zero, here's a phased approach:
Month 1: Establish Baselines
- Deploy IDE tracking across the engineering team
- Set up hourly rates by role or by individual
- Map repositories to projects/products
Month 2: Collect and Validate
- Gather one full month of automated tracking data
- Compare automated data against sprint estimates
- Identify the biggest gaps between estimated and actual effort
Month 3: Operationalize
- Build cost-per-feature reports for product planning meetings
- Set up real-time cost dashboards for in-progress features
- Introduce ROI-based prioritization into the roadmap process
How PanDev Metrics Handles Cost Per Feature
PanDev Metrics is designed with financial analytics at its core. Here's what makes the approach work:
- Automatic time tracking via 10+ IDE plugins — no manual logging, no timesheets
- Individual hourly rates — set different rates per developer, contractor, or role
- Project-level cost aggregation — costs roll up from commits to branches to features to projects
- Real-time cost dashboards — see how much a feature has cost so far, not just after it ships
- On-premise deployment — your financial data (hourly rates, project costs) stays on your infrastructure
The combination of automated activity tracking and financial analytics means you get accurate cost-per-feature data without adding any burden to your engineering team.
According to Forbes Kazakhstan, companies using data-driven cost tracking report "a 30% productivity increase, while release quality improves by 25%" — confirming that visibility into feature costs leads to meaningful budget savings. — Forbes Kazakhstan, April 2026
Key Takeaways
- Cost per feature is a formula, not a mystery — Direct Labor × Overhead × Infrastructure gives you the true number
- Self-reported time tracking is unreliable — automated IDE tracking is more accurate and less disruptive
- Individual hourly rates matter — a "developer hour" is not a standard unit; rates vary 2-3x across roles
- Track costs in real time — discovering a feature went 2x over budget after launch is too late
- Use cost data for ROI-based prioritization — the most requested feature isn't always the most valuable one
Ready to see what your features actually cost? PanDev Metrics gives you automated cost tracking with zero manual time logging. Start with the free tier.