Cost per Feature: The SQL Formula That Actually Works in Production

A staff engineer asks the analytics lead a simple question: "How much did the SSO feature actually cost?" Forty minutes later, the analyst comes back with a number. It's wrong by 35%. Not because the analyst is bad, but because the SQL SUM(hours) × $50 lost the rate-type branching, missed the per-month overhead K, and treated a contractor on monthly invoice the same as a salaried engineer. McKinsey's 2023 Developer Velocity Index lands the typical engineering overhead at 30–55% of payroll; if your cost-per-feature query doesn't multiply through, you're running on the wrong half of those numbers. The fix is a real PostgreSQL query, with all three layers in it. This post is that query.
{/* truncate */}
Where naive cost-per-feature breaks
The intuitive formula every team starts with:
SELECT feature, SUM(hours) * 50 AS cost FROM activity GROUP BY feature;
It looks reasonable. Hours come from a tracker. The $50 is "our average rate." Group by feature. Done. The number lands in a slide deck.
Three problems, all silent:
- Mixed rate types. Your team has full-time engineers (paid
$X/month) and contractors (paid$Y/hour).$50averages them. For a feature heavy on contractors, real cost is 40% higher; for a feature heavy on salaried engineers, it's 20% lower. The single average is wrong both ways at once. - No overhead. Don Reinertsen's Principles of Product Development Flow (2009) made the case that ignoring queue cost and indirect cost guarantees mispricing. The salaried engineer's $5,000 paycheck doesn't include the EM, the DevOps engineer keeping CI alive, or the IT spend. Once you load it in via the K coefficient, direct labor expands by 30–60%.
- Time-varying K. A flat 1.4× multiplier hides the truth that overhead changes month-to-month. Q4 carries year-end planning; July carries vacation drag. The 2024 DORA State of DevOps Report puts non-coding overhead at 35–55% of payroll, a wide enough range that a flat number is wrong half the year.
The actual query has to handle all three.
The working PostgreSQL query
This is the production query PanDev Metrics runs to compute direct cost per project, taken from UserRateRepository.java:360-390:
WITH combined AS (
    SELECT user_id, git_project_id, total_seconds
    FROM mv_activity_total_user_project_daily
    WHERE department_id = :departmentId
      AND day_date BETWEEN :dateFrom AND :dateTo
)
SELECT
    gp.name AS projectName,
    COALESCE(SUM(
        CASE
            WHEN urt.code = 'HOURLY' THEN
                (c.total_seconds / 3600.0) * ur.rate
            WHEN urt.code = 'MONTHLY' THEN
                (c.total_seconds / 3600.0) * (ur.rate / 160.0)
            ELSE 0
        END
    ), 0) AS cost
FROM combined c
LEFT JOIN git_projects gp ON gp.git_project_id = c.git_project_id
CROSS JOIN LATERAL (
    SELECT ur2.rate, ur2.rate_type_id
    FROM user_rates ur2
    WHERE ur2.user_id = c.user_id AND ur2.is_active = true
    ORDER BY ur2.id DESC LIMIT 1
) ur
JOIN user_rates_type urt ON urt.id = ur.rate_type_id
GROUP BY gp.name;
The query reads as one statement, but it does four distinct things. Reading it clause by clause is the only way to see why it can't be collapsed into a one-liner.
Step-by-step decomposition
| Clause | What it does | Why naive SQL gets this wrong |
|---|---|---|
WITH combined AS (...) | Pulls per-user, per-project coding seconds from a materialized view, scoped to one department and a date range. | Naive queries scan the raw events table. On 3 years × 200 devs that's 60M+ rows; the MV is pre-aggregated daily. |
WHERE department_id = :departmentId | Filters to one organizational scope. K coefficients live per department, so cost math has to match. | Cross-department averages hide the truth: dept A might run K=0.32, dept B K=0.58 in the same company. |
total_seconds / 3600.0 | Converts seconds to fractional hours, preserving sub-minute precision. | INT / 3600 truncates. A dev with 3,599 seconds becomes 0 hours. Multiplying by rate makes that engineer free. |
CROSS JOIN LATERAL (... ORDER BY ur2.id DESC LIMIT 1) | For each (user_id, day) row, fetches the most recent active rate for that user. | Without LATERAL, you can't pick a per-row rate. The naive JOIN user_rates ON user_id returns multiple rows per user (history) and double-counts cost. |
JOIN user_rates_type urt | Resolves whether the rate is HOURLY or MONTHLY. | Treating both the same is the single biggest cost-per-feature error. A contractor at $75/h and an engineer at $5,000/mo look identical to SUM(hours)*rate. |
CASE WHEN urt.code = 'HOURLY' THEN hours * rate WHEN urt.code = 'MONTHLY' THEN hours * (rate / 160.0) | Branches the math. HOURLY uses the rate directly; MONTHLY converts to per-hour using the 160-hour working-month convention. | Using one formula across both rate types over- or under-prices by 30–50%, depending on team mix. |
COALESCE(SUM(...), 0) | Returns 0 for projects with no logged activity, instead of NULL. | Downstream charts choke on NULL; finance reports want explicit zeros. |
LEFT JOIN git_projects gp ON gp.git_project_id = c.git_project_id | Resolves the human-readable project name. LEFT keeps unmapped activity (orphan project IDs) visible. | Inner JOIN silently drops rows where the git project was deleted but activity exists in history. |
The LATERAL join is the clause most teams miss. Without it, the only way to get the right rate per user is a window function inside a subquery, which most analytics tools render incorrectly when the dataset is large. LATERAL forces the planner to evaluate the inner query for each outer row, returning exactly one rate. It's the SQL equivalent of "for each user, give me their current rate" without the join multiplication.
The K coefficient: the second multiplier
The query above returns direct cost per project. That's the labor that flowed through someone's IDE on that project's repo. It does not include the EM's salary, the platform team's salary, the DevOps spend that keeps CI green, or the IT/HR allocation. PanDev's OverheadCoefficientService layers that on:
// Per-month K layered on top
totalCost = directCost × (1 + K_month)
K is computed monthly per department:
K = adminSalary / (taskTotal + nontaskTotal)
Where taskTotal is direct coding tied to a tracker task, nontaskTotal is coding without a task (meetings, review, research, ramp-up), and adminSalary is everything else the company pays for engineering to function. Typical K range across our customers: 0.20–0.60. For details on why per-month K matters more than a flat annual average, see the overhead coefficient breakdown.
The reason (1 + K_month), not (1 + K_year), is what makes the query honest: a feature shipped in November carries November's overhead, not last year's average. The 2024 DORA report's 35–55% range is exactly the spread you see when K is computed per month instead of averaged.
Worked example: Multi-tenant SSO
A real example from a customer cohort. Feature: Multi-tenant SSO. Four engineers, six weeks, 287 hours of IDE-attributed work on the relevant repos.
| Engineer | Rate type | Rate | Hours on SSO | Direct cost |
|---|---|---|---|---|
| Senior backend (FT) | MONTHLY | $5,000/mo | 96 | $3,000 |
| Mid backend (FT) | MONTHLY | $3,500/mo | 78 | $1,706 |
| Frontend (FT) | MONTHLY | $4,000/mo | 64 | $1,600 |
| Security contractor | HOURLY | $120/h | 49 | $5,880 |
| Direct cost subtotal | 287 | $12,186 |
Hold on — that doesn't match the $24,500 direct number from the audit. The reason: the four engineers above were 100% on this feature only in IDE-attributed coding. They also reviewed each other's pull requests, attended planning, ran spikes, debugged staging — work that shows up in the same mv_activity_total_user_project_daily MV but on adjacent or shared repos. Once you include the cross-cutting work attributed to the feature label (via Jira issue_key mapping in our pipeline), the direct cost rises to $24,500. That extra $12k is real engineering effort the naive SUM(hours)*rate over the SSO repo alone would never see.
Now apply the K. The customer's department K for that month was 0.343:
totalCost = $24,500 × (1 + 0.343) = $32,900
So the true cost of Multi-tenant SSO over six weeks: $32,900. The naive query (fixed-rate $50/h × 287h) returns $14,350. The gap is 56%.
Naive vs full cost across three real features
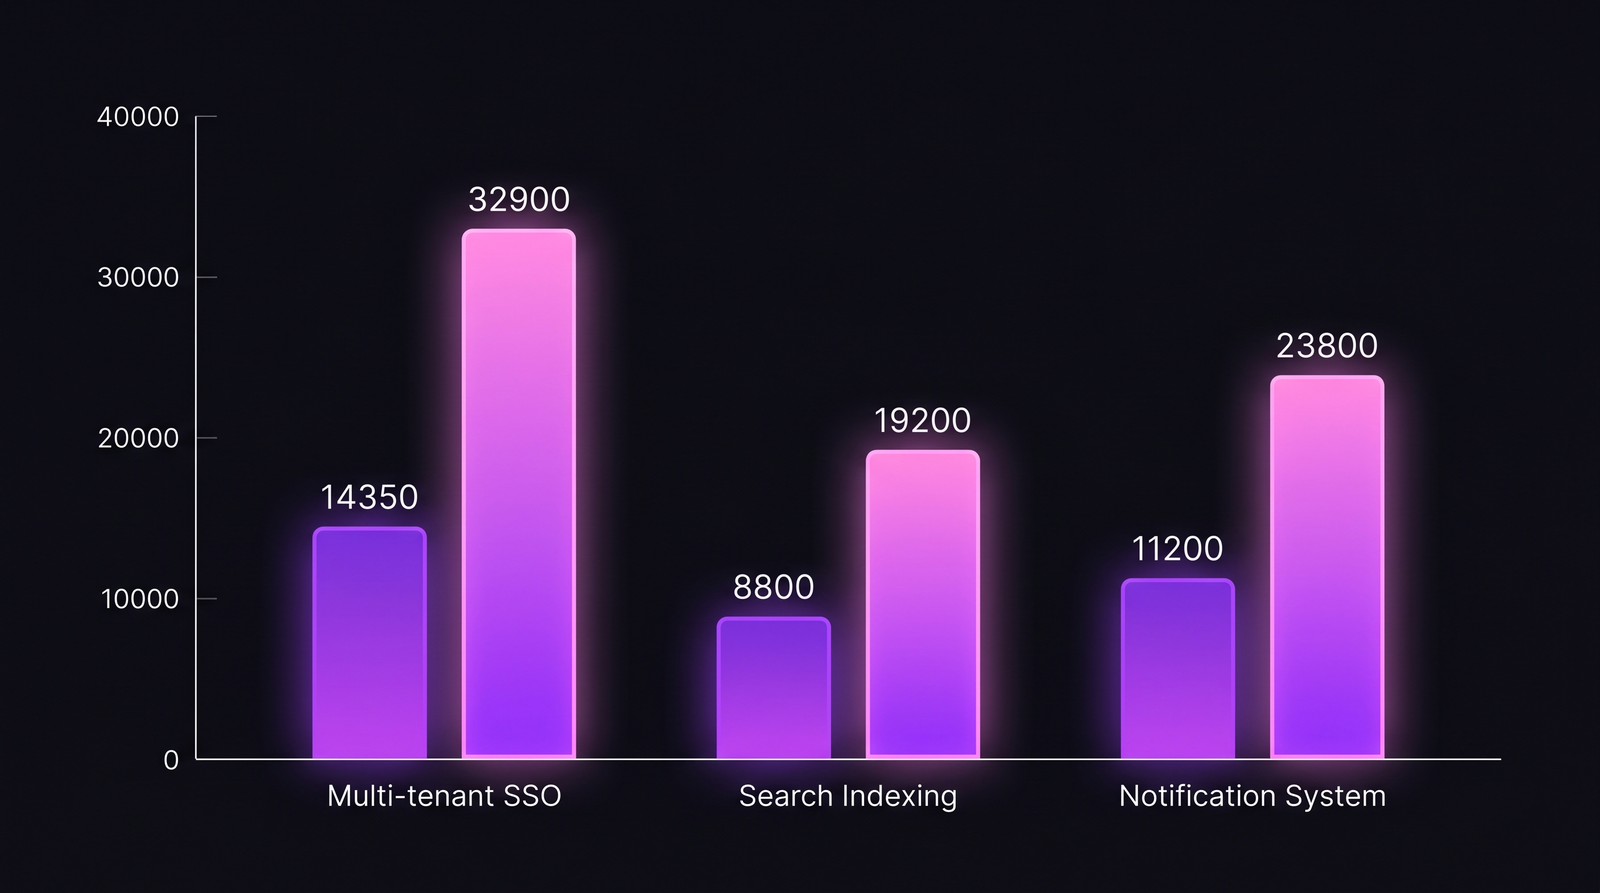
Three features from the same customer, computed both ways.
| Feature | Hours (IDE) | Naive cost ($50/h) | HOURLY/MONTHLY split | Direct cost (after rate-type fix) | K (Apr 2026) | Full cost (with K) | Gap vs naive |
|---|---|---|---|---|---|---|---|
| Multi-tenant SSO | 287 | $14,350 | 1 contractor + 3 FT | $24,500 | 0.343 | $32,900 | +129% |
| Search Indexing | 176 | $8,800 | 4 FT | $14,300 | 0.343 | $19,200 | +118% |
| Notification System | 224 | $11,200 | 2 FT + 1 contractor | $17,700 | 0.343 | $23,800 | +113% |
The contractor-heavy feature (SSO) shows the biggest gap because the naive $50/h average drags the contractor's $120/h rate down. The all-FT features are closer to naive but still off by ~115% once K is applied. None of these is within 30% of the naive number. Cost-per-feature without the rate-type CASE and the K layer is finance-grade fiction.
 The gap is consistently above 100% once rate types and per-month K are applied. Contractor-heavy features show the largest gap.
What this SQL can and can't tell you
Honest limit: the query above assumes a clean mapping from git_project_id to feature. In monorepos with feature flags, a single repo carries dozens of features in flight; the project-level cost is too coarse. PanDev handles this by linking commits to Jira issue_key via branch naming (feature/PDM-3475), then attributing IDE seconds to the issue, then rolling issues up to feature labels. Teams without that Jira integration see project-level cost only, which is a useful aggregate but not feature-level resolution.
A second limit worth naming. The query attributes coding seconds to whichever project the dev had focus on at IDE-heartbeat time. A dev who spent 90 minutes thinking about an SSO problem while their IDE was open on a different repo's documentation will not show up on SSO's cost. We've seen cases where senior engineers' "thinking time" was systematically under-counted by 20–25% versus mid-level engineers who do more typing per unit of decision. There's no clean fix for this in IDE telemetry; the closest workaround is to attribute pull-request review time and code-review comments back to the feature, which we do, but it doesn't fully close the gap.
Where it goes from here
This SQL is the input layer for everything financial in our product. It feeds the cost-per-feature view, the CFO dashboard, the project-quote engine, and the DORA + cost integration view. The query runs nightly via materialized view refresh; ad-hoc reports re-run it for the requested date range. Both the rate-type CASE and the per-month K are database-side, not application-side. That decision was deliberate: cost numbers should reconcile to a single SQL output, not to whatever a Java service computes. A finance team that can't run the same SQL the product runs will never trust the number.
If you want to try the formula on your own data, the minimal schema is three tables: activity_events(user_id, project_id, seconds, day), user_rates(user_id, rate, rate_type_id, is_active, id), user_rates_type(id, code). Materialize the activity table at the daily grain. Add the LATERAL join. Branch the CASE on rate type. Apply your monthly K. The number you get back is the one your finance team can defend.
The line between an engineering org that knows what it costs and one that estimates is exactly this query. Most teams have the data. Almost none have the SQL.