Cost per Sprint: Bringing Money to the Retro Table

Sprint 47, 8-person team. The standard retro narrative would be: "Velocity dropped 20%, lots of bug fires, we'll prioritize better next sprint." Same vibe as Sprint 46. Same vibe as Sprint 45. Now add one number to the same retro: total sprint cost was $32,800, of which $11,600 (35%) went to bug-fix tickets versus $14,200 (43%) to features. The team's rolling-average bug share is 18%. That single line, "we doubled our usual bug spend this sprint," moved the team from "we'll do better" to "Sprint 48's first three days are bug-prevention only, full stop."
This article shows how to wire one financial number into a 30-minute retro so it produces decisions, not vibes.
Why retros stop changing behavior after sprint 4
Atlassian's 2024 Agile Practitioner Report measured how often teams revisit action items from the previous retro: 62% never do. Esther Derby and Diana Larsen wrote Agile Retrospectives: Making Good Teams Great in 2006 around exactly this failure: the ritual outlives the discipline. Two decades later, scrum.org's 2023 survey of 4,200 practitioners ranked "retros feel performative" as the top complaint from senior engineers.
The mechanism is boring: people debate feelings. Feelings tilt toward the loudest voice in the room. The loudest voice tilts toward the most recent pain. So every retro re-litigates last week's incident, and the team never sees the pattern across the last six sprints.
DORA's State of DevOps reports have been making the same structural point since 2019: high-performing teams measure across the system, not at the moment. A retro that opens with "how did everyone feel?" is the inverse of that.
The contrarian bit: ONE number does the work
Most "data-driven retro" articles tell you to bring 8 metrics: velocity, cycle time, lead time, MTTR, change failure rate, deployment frequency, planned-vs-delivered, unplanned ratio. That's a dashboard, not a retro. The team's eyes glaze over by minute 4.
Bring one number instead: total sprint cost, broken into 3-4 issue-type buckets. Features, bugs, tech-debt, unscoped meetings/calls. That's it.
The reason it works: cost converts qualitative argument into quantitative comparison. "We had a lot of bug fires" is debatable. "We spent $11,600 on bugs versus $6,200 last sprint" is not. The room stops debating the claim and starts debating what to do about it.
What "total sprint cost" actually means
Take the team's loaded hourly rate (see Loaded Hourly Rate for the math). Multiply by tracked sprint hours per engineer. Sum across the team. Then split that total by Jira issue type using time tracked against each ticket.
For an 8-person team at ~$60/hr loaded rate × 80 hours/sprint × 8 engineers, raw capacity is roughly $38,400. Tracked-and-billable usually lands $30K-$34K after meetings, vacation, and PTO get stripped. That's your sprint cost.
PanDev Metrics computes this automatically. The POST /departments/{id}/finance/costs endpoint accepts granularity = DAILY|MONTHLY|QUARTERLY and returns time-series cost data with percentageChange (sprint-on-sprint delta) and trend (UP/DOWN) baked into every response. Each cost row carries an issue_key join, so the breakdown by feature/bug/tech-debt comes free. The bar-chart widget (costs-widget.tsx) renders the stacked monthly view we'll show below. Without that, you can rebuild the same number in SQL: see Cost per Feature: SQL Formula for the join pattern.
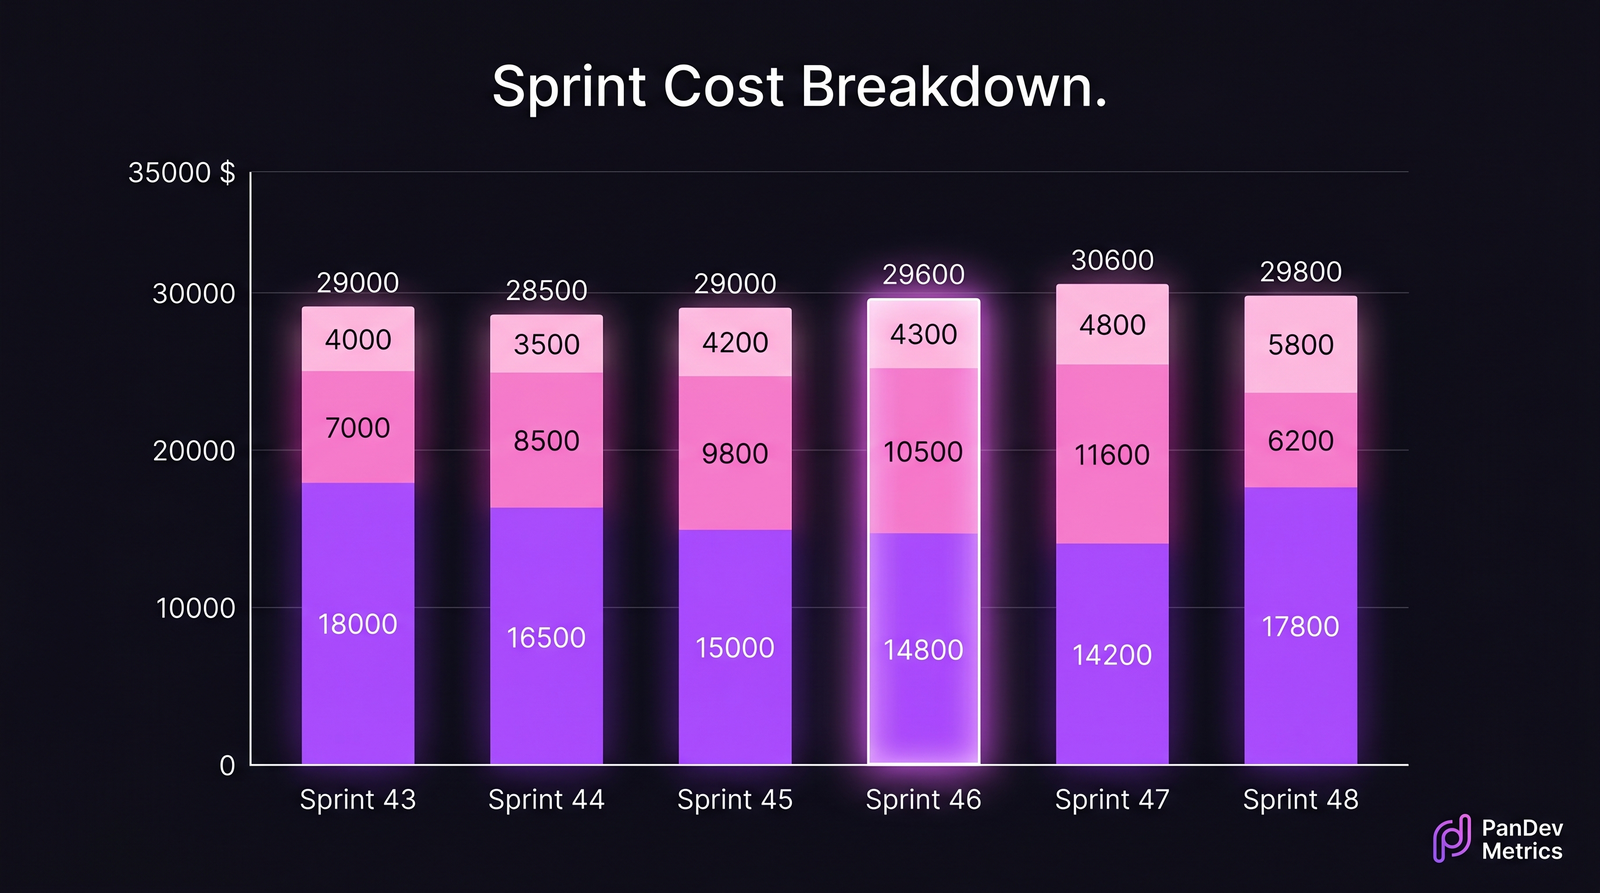 Six sprints for the same 8-person team. Sprint 47 is the bug-share spike that triggered the action item. Sprint 48 shows the result.
Real example: Sprint 47 → Sprint 48
The team I'm describing is real (anonymized). 8 backend engineers, fintech, fixed 2-week sprints. Their last six sprints looked like this:
| Sprint | Total cost | Features | Bugs | Tech-debt | Bug share | Δ vs prev |
|---|---|---|---|---|---|---|
| 43 | $29,000 | $18,000 (62%) | $7,000 (24%) | $4,000 (14%) | 24% | — |
| 44 | $28,500 | $16,500 (58%) | $8,500 (30%) | $3,500 (12%) | 30% | −2% |
| 45 | $29,000 | $15,000 (52%) | $9,800 (34%) | $4,200 (14%) | 34% | +2% |
| 46 | $29,600 | $14,800 (50%) | $10,500 (35%) | $4,300 (15%) | 35% | +2% |
| 47 | $32,800 | $14,200 (43%) | $11,600 (35%) | $4,800 (15%) | 35% | +11% |
| 48 | $29,800 | $17,800 (60%) | $6,200 (21%) | $5,800 (19%) | 21% | +1% |
Three things jump off the table that no qualitative retro caught:
- Bug share crept up sprint-on-sprint from 24% to 35% over four sprints. Slow drift, never alarming in any single retro.
- Sprint 47 wasn't dramatically worse on bug share than 46, but absolute bug spend went from $10,500 to $11,600 and total sprint cost spiked $3,200 (overtime, brought in two extra hands). That combination only shows up in dollars.
- Sprint 48's intervention ("first 3 days, bug-prevention work only") moved bug share to 21%. Roughly $5,400 redirected back into features. The team felt the effect because the next standup wasn't a triage call.
That's a measurable change. Not a vibe.
The retro template: ask, look, decide
Bring four columns into the retro doc 15 minutes before start. Don't discuss; just paste.
| What to ask | What number to use | What action it enables |
|---|---|---|
| Where did our money go? | Total cost split by issue type (% of sprint) | Reorder priorities for next sprint |
| Did the bug share change? | Bug % this sprint vs rolling 6-sprint average | Trigger a bug-prevention focus block if drift > 5pp |
| Where did unscoped time go? | Cost of tickets that entered after sprint planning | Tighten planning OR widen capacity buffer |
| Are we paying tech-debt down? | Tech-debt % across last 4 sprints | If trending toward zero — schedule a debt sprint |
Strict 30 minutes. The first 5 are silent: everyone reads the table. The next 15 are discussion of one row, the one with the largest delta. The last 10 produce a single named action item with a measurable check. Sprint 48's check was: "bug share under 25% by Friday." That's a number you can verify on Monday.
Common mistakes that wreck the financial retro
| Mistake | Why it hurts | Fix |
|---|---|---|
| Mixing meetings into "tech-debt" | Inflates debt cost, hides true planning waste | Add a 4th bucket: unscoped meetings/calls |
| Showing cost per engineer | Shifts conversation to performance, not system | Aggregate at team level only |
| Using cost as a target ("get sprint cost down") | Teams gaming the number, less work tracked | Cost is a diagnostic, not a target. Say so out loud |
| Pulling numbers during the retro | Eats the meeting, breaks flow | Facilitator pastes 15 min before; no live queries |
| Tracking 8 issue types | Nobody can hold them in working memory | 3-4 buckets max, always |
Where this breaks
Cost per sprint is most useful for teams that already practice fixed-length sprints. Teams running on continuous flow (Kanban) get more value from cost per cycle or cost per deploy. The sprint boundary doesn't exist for them, so the number has nothing to anchor against. For those teams, see Cost per Task: Issue-Tracking Approach, which works at the ticket level instead.
The financial breakdown also requires honest issue typing. If "bug" tickets quietly get retitled as "feature" to make the stats look better, the data lies, and the team's instinct will be louder than the number, which defeats the point. Ship the rule: typing is set at ticket creation by the reporter, not edited later. Re-classifying mid-sprint requires a comment.
One more limit: at very small teams (under 5 engineers), single-engineer absences swing the cost split enough that any one sprint is noise. Look at rolling 4-sprint averages, not single-sprint deltas. The number is still useful, just used differently.
How to measure if the retro is working
- Action item completion rate: did the named action from the previous retro actually ship? Aim for 80%+ over a quarter.
- Bug-share variance: shrinking standard deviation across sprints means the team is actively managing the mix, not reacting to it.
- Time-to-decision in the retro itself: if discussion-to-action regularly takes 25 of 30 minutes, the data isn't doing its job; tighten the table.
These are what move when retros stop being performative. Velocity doesn't have to change. Cycle time doesn't have to change. The split of where the team spent money does.
What you can do today
Pull last sprint's hours-by-issue-type from Jira or your tracker. Multiply by team loaded rate. Drop the four-column table (cost, % of sprint, sprint-on-sprint delta, rolling average) into next Friday's retro doc 15 minutes before start. Don't comment on it. Then watch which row gets the most pointed finger.
That's the row that runs the meeting. The team will tell you what to do about it.