Cost per Jira Ticket: Trace Spend to a Single Issue

In Q1 2026 we instrumented an engineering organization that reported a healthy "$340K spent on Project X this quarter." Drilling down, the top five tickets told a different story. PROJ-1245 refactor auth: $4,820. PROJ-1281 date-format bug: $3,140. A two-hour bug fix that cost more than half of an architectural refactor. Six engineers had touched it across three weeks because nobody owned it.
You cannot have that conversation with a project-level number. You can have it with a ticket-level number. That is the entire argument of this post, and the reason most engineering finance tools are debating the wrong layer.
{/* truncate */}
Why project-level cost is the wrong unit
LinearB, Jellyfish, Code Climate Velocity, and most Engineering Intelligence tools report cost roughly the same way: aggregate engineer time into a project bucket, multiply by loaded rate, present as a quarterly number. It is a real number. It is also useless for the conversation that matters in a sprint review.
Atlassian's State of Teams 2024 report found that the average Jira issue moves through 6 status transitions and is touched by 3.4 different people before it closes. That is the unit where decisions actually live. Project-level cost averages those transitions away. By the time a "$340K project" appears in a CFO deck, the specific tickets that ballooned are fully laundered.
DORA's research, summarized in the 2023 Accelerate State of DevOps Report, repeatedly shows that cycle time is a leading indicator of cost. Not because slow tickets cost more by the hour, but because slow tickets accumulate context-switch tax across multiple owners. You can only see that tax if you can name the ticket. A project-level dashboard hides it on purpose.
Forrester's 2024 Engineering Effectiveness research notes that fewer than 18% of engineering organizations can answer "what did this specific feature cost us?" with any precision. The number for "what did this specific ticket cost us?" is functionally zero. That is the gap. We covered the feature-level version of this problem in cost-per-feature; this post drops one more aggregation level.
The mechanic: per-ticket cost is a join, not a magic trick
Per-ticket cost requires three things and nothing more:
- IDE telemetry that knows which task each minute of coding was spent on (via branch name → task key)
- A loaded hourly rate per engineer (see loaded-hourly-rate-true-cost)
- A Jira (or ClickUp, Linear, Asana) issue_key on every commit, branch, or worklog
In PanDev Metrics, the storage layer for this is a materialized view called mv_activity_total_user_issue_daily. It joins editor activity events with the parsed Jira issue key from the active branch and aggregates per user per day:
-- Schema (simplified)
CREATE MATERIALIZED VIEW mv_activity_total_user_issue_daily AS
SELECT
  ae.user_id,
  ae.day_date,
  SUM(ae.active_seconds) AS total_seconds,
  ae.issue_key,
  ae.department_id
FROM activity_events ae
WHERE ae.issue_key IS NOT NULL
GROUP BY ae.user_id, ae.day_date, ae.issue_key, ae.department_id;
For today's data, where the materialized view hasn't refreshed yet, a live function f_mv_activity_total_user_issue_daily_today() returns the same shape from the underlying tables. The cost calculation then layers on top:
SELECT
  m.issue_key,
  SUM(m.total_seconds / 3600.0 * r.loaded_hourly_rate) AS cost_usd,
  COUNT(DISTINCT m.user_id) AS engineers,
  SUM(m.total_seconds) / 3600.0 AS hours
FROM mv_activity_total_user_issue_daily m
JOIN engineer_rates r ON r.user_id = m.user_id
WHERE m.department_id = 17
  AND m.day_date BETWEEN '2026-04-14' AND '2026-05-13'
GROUP BY m.issue_key
ORDER BY cost_usd DESC
LIMIT 10;
Same SQL pattern as project-level cost, one less GROUP BY collapse. That is the only mechanical difference. The interpretive difference is enormous.
This SQL pattern is the same one we walked through in cost-per-feature-sql-formula. The change here is the granularity, not the formula.
What the top-10 actually looks like
Here is a real distribution from a 14-engineer team in Q1 2026, $95/hr blended loaded rate, 30-day window:
| Rank | Issue Key | Type | Priority | Owner | Hours | Engineers | Cost |
|---|---|---|---|---|---|---|---|
| 1 | PROJ-1245 | Refactor | P2 | A. Petrov | 62 | 4 | $4,820 |
| 2 | PROJ-1281 | Bug | P1 | unassigned → 6 owners | 49 | 6 | $3,140 |
| 3 | PROJ-1303 | Migration | P2 | M. Chen | 38 | 3 | $2,950 |
| 4 | PROJ-1319 | Bug | P3 | I. Volkov | 30 | 2 | $2,320 |
| 5 | PROJ-1330 | Hotfix | P1 | S. Rasulov | 22 | 3 | $1,860 |
| 6 | PROJ-1352 | Story | P2 | T. Lee | 19 | 2 | $1,640 |
| 7 | PROJ-1366 | Story | P3 | A. Petrov | 17 | 1 | $1,420 |
| 8 | PROJ-1378 | Bug | P2 | M. Chen | 14 | 2 | $1,280 |
| 9 | PROJ-1391 | Story | P3 | D. Aliyeva | 13 | 1 | $1,110 |
| 10 | PROJ-1402 | Bug | P3 | I. Volkov | 11 | 1 | $980 |
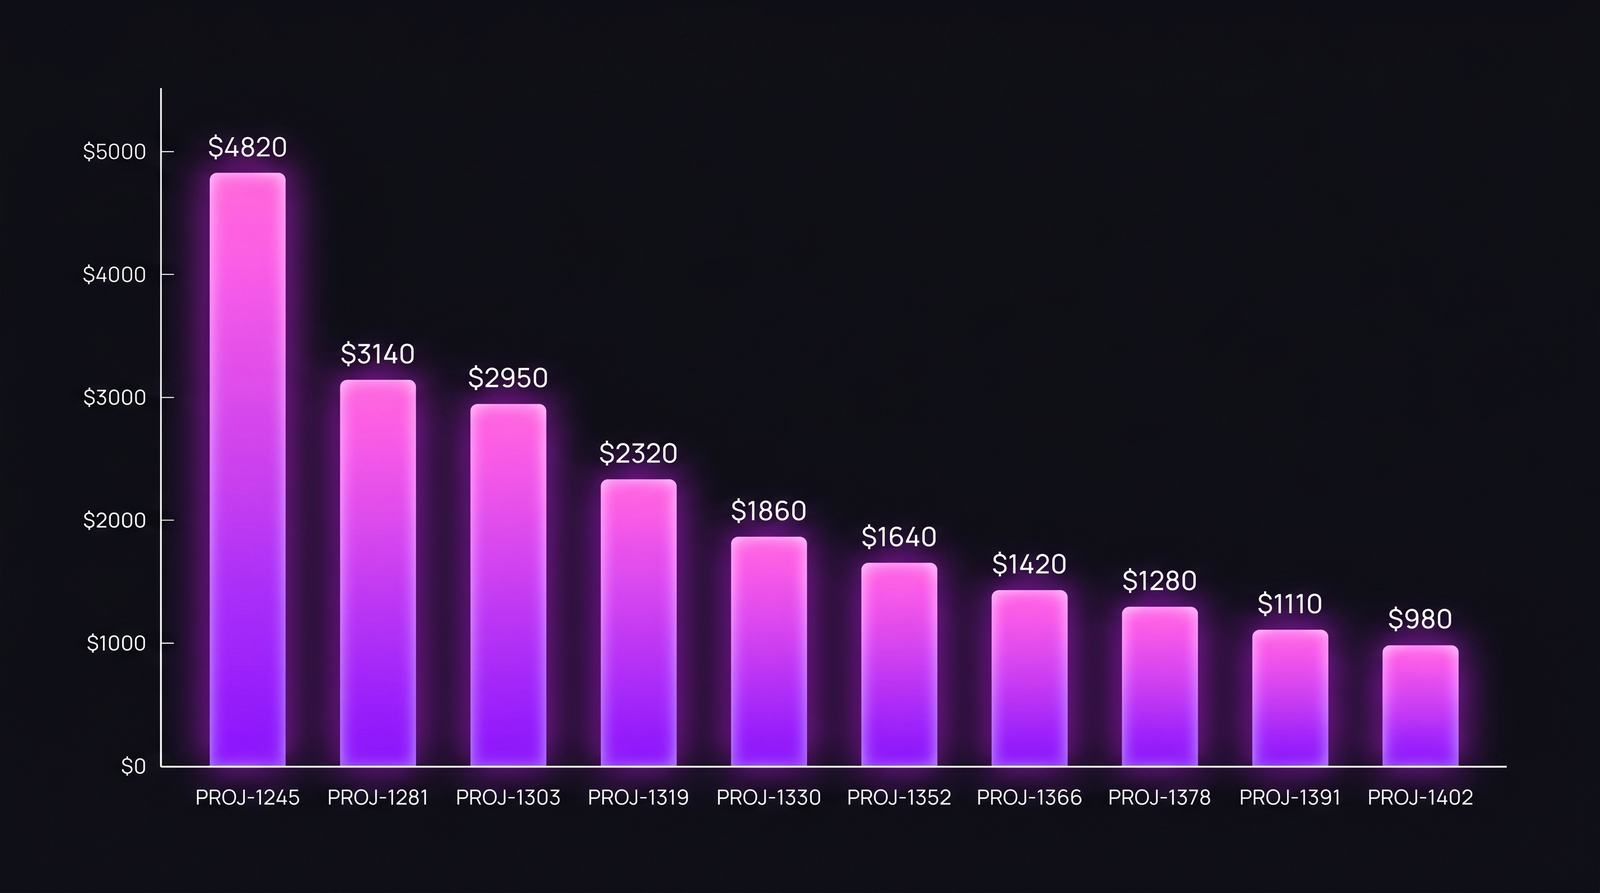 The distribution is steep: rank 1 is roughly 5x rank 10. That ratio is typical, not exceptional.
Three things this table reveals that a project-level number cannot:
The unowned-bug tax. PROJ-1281 was a date-format bug filed as P1 and triaged as "two-hour fix." It cost $3,140 and consumed 49 hours across six engineers because no single owner shepherded it. Each engineer who touched it spent 30-90 minutes loading context, applying a partial fix, and handing off. The bug closed eventually. Six handoffs is the actual story.
Refactors are not the villains. Engineers love to point at refactors as "where the budget goes." PROJ-1245 (the refactor) cost $4,820, but it had a clear owner, ran 4 engineers in parallel for 62 focused hours, and shipped clean. Per-hour-of-engineer-attention, it is by far the most efficient line item on the list.
P3 bugs out-cost P2 stories. PROJ-1402 (a P3 bug) cost more than several P3 stories combined. Bugs do not respect their priority labels. They expand to fill the time available, especially when reproduction is unreliable.
The hotfix distribution: where averages lie
Top-10 is the headline. The distribution within a single ticket type is the structural finding. Here is the same dataset for "hotfix" tickets, 50 instances over the same 30-day window:
| Statistic | Hotfix cost |
|---|---|
| Median | $620 |
| Mean | $1,140 |
| p75 | $1,420 |
| p90 | $2,640 |
| p95 | $3,800 |
| Max | $5,210 |
The mean is 1.8x the median. That gap is the entire problem with reporting "average hotfix cost" to a CFO. The median hotfix is a 6-hour fix that closes cleanly. The p95 hotfix is a multi-day expedition that touched four engineers, spawned two follow-up tickets, and required a war-room call. They are not the same animal. Calling them both "hotfixes" and averaging the cost gives you a single number that describes neither.
If the CFO asks "what did our hotfixes cost last quarter?", the right answer has at least three values: median, p95, and the count above $2,000. Anything less hides the long tail that is doing the actual budget damage.
The conversation per-ticket cost lets you have
A project-level number gets you to "we should spend less on Project X." That is a strategy debate, and strategy debates take six weeks and produce a slide deck.
A ticket-level number gets you to "PROJ-1281 cost $3,140 and we still don't know who owns date formatting." That is an operational debate, and it takes 15 minutes in a sprint retro to fix.
In PanDev Metrics, this lives as the EmployeeTasksWidget on the personal finance dashboard. For every engineer it surfaces the single most expensive ticket they touched in the period. Not their total cost, the worst offender. Total cost rewards the people who logged the most hours; most-expensive-touched surfaces the tickets where attention got stuck. The worst-offender column is where the prioritization conversation actually starts.
The companion view is /dashboard/finances/task/:taskId, the per-ticket dynamic. It is a single-ticket cost-over-time chart that shows when each engineer's effort landed. PROJ-1281 in our example shows six clear bursts, three weeks apart, each from a different engineer, none of them adjacent. That is a picture of "we never owned this." A waterfall of bursts means the ticket got handed around. A single tall column means one person sat on it. The shape is the diagnosis.
The API endpoint behind both views is POST /departments/{id}/finance/tasks. It returns a paginated task list with cost, percentageOfTotal, and percentageChange versus the prior period. That lets you see not just expensive tickets, but tickets whose cost has accelerated week over week. The acceleration is usually the more useful signal. A ticket that doubles in cost between sprints is a leading indicator that ownership has slipped.
For teams already using DORA, the leading-indicator framing fits cleanly into the DORA metrics 2026 framework. High lead time on a single ticket is the expensive-ticket smoke alarm.
How to actually use this in a sprint retro
The mechanic is dull. The discipline of using it is where teams differ. A working pattern:
- Pull the top-5 tickets by cost for the closed sprint, not the open one. Closed sprints have stable data.
- For each ticket, ask: was this ticket cost expected? If a 5-day refactor cost $4,800, that is exactly what was budgeted. If a "2-hour bug" cost $3,140, that is the conversation.
- For each unexpected ticket, ask one specific question: who should have owned this and didn't? Not "why did this happen". That produces a postmortem. "Who should have owned this" produces a name and a process change.
- Track the same ticket type's p95 cost across sprints. If your hotfix p95 climbs from $3,800 to $5,400 over a quarter, you have a structural problem with hotfix triage. If it stays flat, you are operating a normal incident pipeline.
- Don't review every ticket. The point of per-ticket cost is to surface the 5% that broke the budget, not to micromanage the 95% that worked. Optimizing the wrong layer is its own waste.
The honest limit
Per-ticket cost requires reliable Jira ↔ commit linkage. If your team doesn't follow a branch-naming convention like feature/PROJ-1234-description or doesn't include the issue key in commit messages, attribution falls back to project-level. The engine simply has no key to join on. Teams using Linear, ClickUp, or Asana have the same requirement with their own key formats (ENG-1234, CU-abc123, T1234).
In our deployments, branch-naming compliance is the single biggest predictor of how useful the finance module ends up being. Teams above 90% compliance get clean ticket-level cost. Teams below 70% see a lot of "(unattributed)" rows and spend two months fixing the convention before the dashboards are worth opening. There is no clever ML workaround for that. If the data isn't tagged at the source, no aggregation downstream can recover it.
The other limit worth flagging: per-ticket cost does not account for review/test time spent by people who never touched the branch. A reviewer who spent 90 minutes on a PR but never checked out the branch contributes zero ticket-level seconds in the IDE-heartbeat model. We surface that gap separately as review-load metrics, but it is honestly a known imperfection of the per-ticket cost number. The ticket cost is a lower bound on true cost.
What to do tomorrow morning
If you have IDE telemetry plus branch-naming conventions, the SQL above gives you ticket-level cost directly. Without IDE telemetry, Jira's own time-tracking is a reasonable approximation, with the caveat that self-reported worklog time runs 30-40% lower than IDE-telemetry time on teams where we've measured both.
The move is the same either way: name the most expensive ticket from your last sprint, pull up its history, and ask whether anyone owned it. If the answer is "kind of," that is the $3,000 you can save next quarter. The conversation is short. The number is small enough to act on.
Project-level cost tells you what you spent. Per-ticket cost tells you which decisions to make differently next sprint. Those are different products, and most engineering finance tools only ship the first one.