Crypto/Web3 Engineering: Metrics for DeFi and L2 Teams

A Solidity engineer pushing a mainnet contract has less forgiveness than a SpaceX launch engineer. Once deployed, the code is immutable, auditable by anyone, and often controls more value than the engineer's employer has in their treasury. Total Value Locked across DeFi protocols crossed $200B in Q1 2026 (DefiLlama data). Engineering metrics built for web2 SaaS break here.
Deployment frequency means nothing when the "deployment" is a proxy upgrade that requires a 48-hour timelock vote. Lead time means nothing when the last stage is a $200K external audit. We worked with 3 Web3 teams — two L2 rollup teams, one DeFi protocol — and rebuilt the metric stack around constraints web2 doesn't have.
{/* truncate */}
Why Web3 engineering is different
Web3 has three constraints that rewrite the playbook.
Immutability. A deployed smart contract cannot be patched. Upgradeable proxies exist but require social consensus — timelock + multisig + often a DAO vote. "Move fast and break things" is a literal attack vector.
Adversarial environment. Every deployed contract is public code with a public bounty. A Trail of Bits research report noted that 78% of DeFi exploits in 2023 came from known vulnerability classes already flagged in at least one audit report the team had seen. Engineering velocity is meaningless if the shipped code is exploitable.
Gas as a first-class metric. An L2 rollup team measures the same thing users pay for: per-call gas cost. A 15% gas reduction on a core function is equivalent to a 15% price cut for every user of the protocol, forever.
Most engineering intelligence platforms ignore these. The result: a DORA dashboard next to a protocol that got drained.
The metrics that matter here
We'll skip deployment frequency and MTTR — not useless, but secondary. Five metrics actually matter:
1. Audit cycle time
Definition: time from audit-ready branch tagged → external audit report received → all critical/high findings closed.
DeFi teams live and die by audit cadence. OpenZeppelin's 2024 audit throughput report showed median audit duration at 21 days for "medium-complexity" smart contract suites, with remediation adding another 12-15 days. Teams that hit every protocol upgrade with an audit cycle above 45 days effectively ship one major release per quarter.
Track:
- Days from tag to audit start (queue wait — often the bottleneck)
- Days from audit start to report
- Days from report to all-critical-closed
- Findings-per-kLoC (benchmark vs past cycles)
| Audit stage | Median (our 3 teams) | Best-case L2 team |
|---|---|---|
| Queue wait | 14 days | 3 days (retainer) |
| Audit execution | 18 days | 12 days |
| Remediation | 11 days | 4 days |
| Total cycle | 43 days | 19 days |
The retainer model (pre-paid audit slots) is the single biggest lever — cuts queue wait by an order of magnitude.
2. Gas efficiency delta per release
Definition: for each changed function, compare gas usage before and after the release. Track as percentage delta.
L2 teams we work with benchmark every commit. A seemingly innocent refactor adding a SLOAD inside a loop can double gas for a hot path — users pay. Before-merge gas diffs in CI are the minimum bar; tracking per-release aggregate delta over time is the serious version.
Healthy rolling 12-week trend: gas/function decreases or flat ±3%. Increasing gas across releases is an architectural smell, not just a perf issue.
3. Time-to-timelock-merge
Definition: time from code "ready" → passed audit + governance proposal → executed via timelock.
This is Web3's lead-time-for-changes analogue. DORA's 4 stages (commit → PR-open → merge → deploy) don't fit. Web3 stages:
| Stage | Control plane | Typical duration |
|---|---|---|
| Commit → PR merged | Engineering | 2-5 days |
| Merged → Audit complete | Vendor | 20-40 days |
| Audit → Governance proposal | Product/Eng | 3-7 days |
| Proposal → Timelock executed | DAO + chain | 2-14 days |
| Total | 27-66 days |
Teams that conflate engineering velocity with protocol velocity get burned — most delay is outside engineering's control.
4. Exploit-class coverage
Definition: percentage of OWASP / SWC / Trail of Bits vulnerability classes covered by test suite + fuzzing + formal verification.
The Trail of Bits 2023 figure (78% of exploits from known classes) is the pitch. Tracking coverage against a reference list changes the security conversation from "did we audit?" to "did we test for this specific attack class?".
Common reference lists:
- SWC Registry — 136 smart contract weakness classes
- Trail of Bits "Building Secure Contracts" guide
- Consensys Diligence checklist
5. Multisig response time
Definition: from "pause needed" signal to quorum signatures collected and transaction executed.
A DeFi protocol's kill-switch is only as fast as its signers. Multiple teams we work with found that their multisig response time was longer than the block time of the chain they needed to pause — meaning an exploit was confirmed before they could react. Target: ≤ 60 seconds at 24/7 coverage. Most teams we benchmarked are at 8-30 minutes.
 The Web3 metric stack diverges from web2 DORA at every layer — audit vendors, on-chain governance, gas benchmarks.
How compliance and adversarial environment change measurement
Two things shift the work beyond "DORA with extra steps".
On-chain observability ≠ app telemetry. A Web3 team can (and should) track its own protocol's on-chain activity: failed transactions, reverts-per-block, gas outliers. The CNCF 2024 survey noted only 14% of Web3 teams integrate on-chain metrics into their engineering observability stack — the rest treat chain and code as separate universes. That gap is where exploits live.
Budgeted exploit response. Every engineering-week should have a reserved slice for exploit review. Web2 teams budget 10-20% for "tech debt" and usually skip it. Web3 teams that treat "monitor the Twitter of @samczsun, @banteg, and every competitor's post-mortem" as engineering work catch exploit patterns earlier. Not romantic. Cuts your exploit probability more than another audit.
The pattern: typical DeFi / L2 team
From the three teams we worked with:
| Team type | Headcount | Main metric |
|---|---|---|
| L2 rollup infra | 14 eng | Gas-per-rollup-batch cost |
| DeFi lending protocol | 9 eng | TVL / eng-week (capital efficiency of engineering) |
| Cross-chain bridge | 11 eng | Exploit-class coverage % |
The lending protocol metric — TVL per engineering-week — is controversial. Not every unit of TVL is engineering-caused. But tracked over 12 weeks, it tells you when protocol growth outpaces engineering capacity to secure it. That's the burnout + exploit leading indicator nobody else watches.
Where PanDev Metrics fits
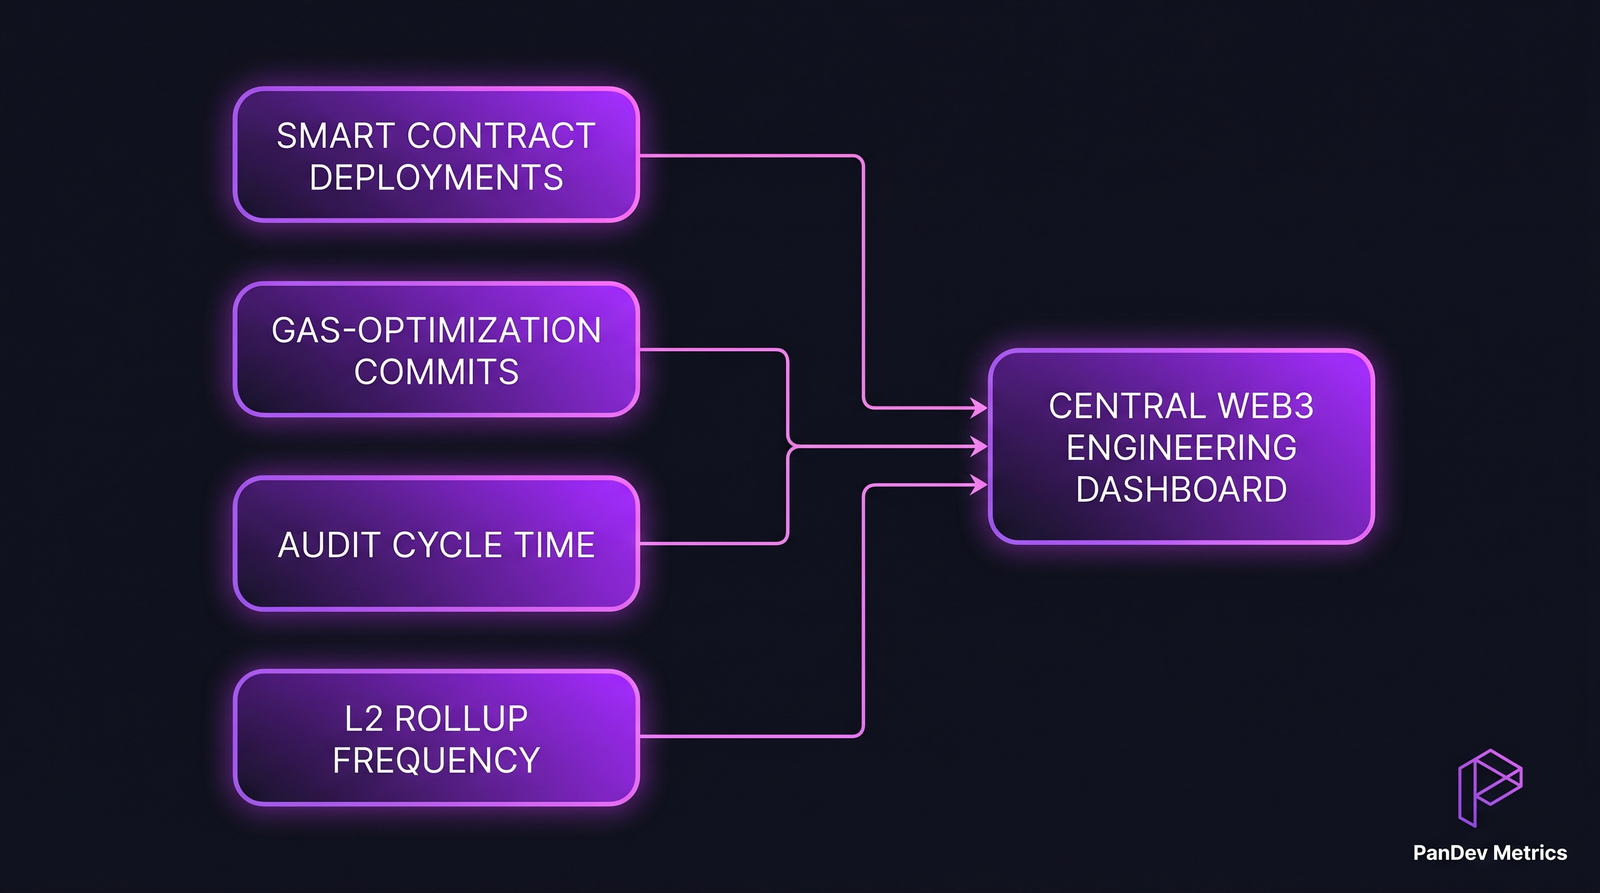
Our IDE heartbeat collector doesn't know Solidity vs TypeScript from first principles — it sees the file extension and language. For Web3 teams we track: time in Solidity files vs test files vs TS/Rust integration code (useful ratio — mature teams spend 30-40% of Solidity work in tests), branch/task linking for audit remediation cycles, and deploy events from Hardhat/Foundry pipelines.
The Git-convention rule (fix/AUDIT-204, feature/L2-BATCHING-88) matters more here than in web2 because audit remediation tasks and governance-proposal tasks are separate flows — without branch naming they get conflated on the dashboard.
Our data here is thin. Three teams isn't an industry — it's an anecdote with shared patterns. We don't have signal on L1 client teams (Geth, Reth, Erigon), where the work is closer to systems programming. If you run an L1 client team, this post generalises badly to you.
Where most Web3 engineering dashboards go wrong
They copy a web2 dashboard. Deploy frequency. PR throughput. Lines of code. None of those correlate with what the protocol actually needs — secure code shipped through a long pipeline.
A Web3 engineering dashboard worth looking at has gas at the top, audit cycle in the middle, and commit velocity at the bottom. Inverted from SaaS.
Related reading
- Engineering Metrics in Fintech: Compliance, Speed, and Security — adjacent domain
- DORA Metrics: The Complete Guide for Engineering Leaders — the framework Web3 has to adapt, not adopt
- Change Failure Rate: Why 15% Is Normal and 0% Is Suspicious — the Web3 target is 0% for mainnet, which is itself suspicious