How to Reduce Cost of Delivery by 30% Without Losing Quality

A Series B SaaS company with a 35-person engineering team was spending nearly $800K per month on software delivery. The CEO wanted to cut costs. The board suggested reducing headcount. The CTO proposed a different approach: find the waste first, then eliminate it.
Six months later, monthly delivery cost dropped to roughly $540K — a reduction of more than 30% — while deployment frequency actually increased. No layoffs. No quality regression. McKinsey's research on developer productivity supports this pattern: the biggest efficiency gains come from eliminating process friction, not cutting headcount.
Here's the playbook.
{/* truncate */}
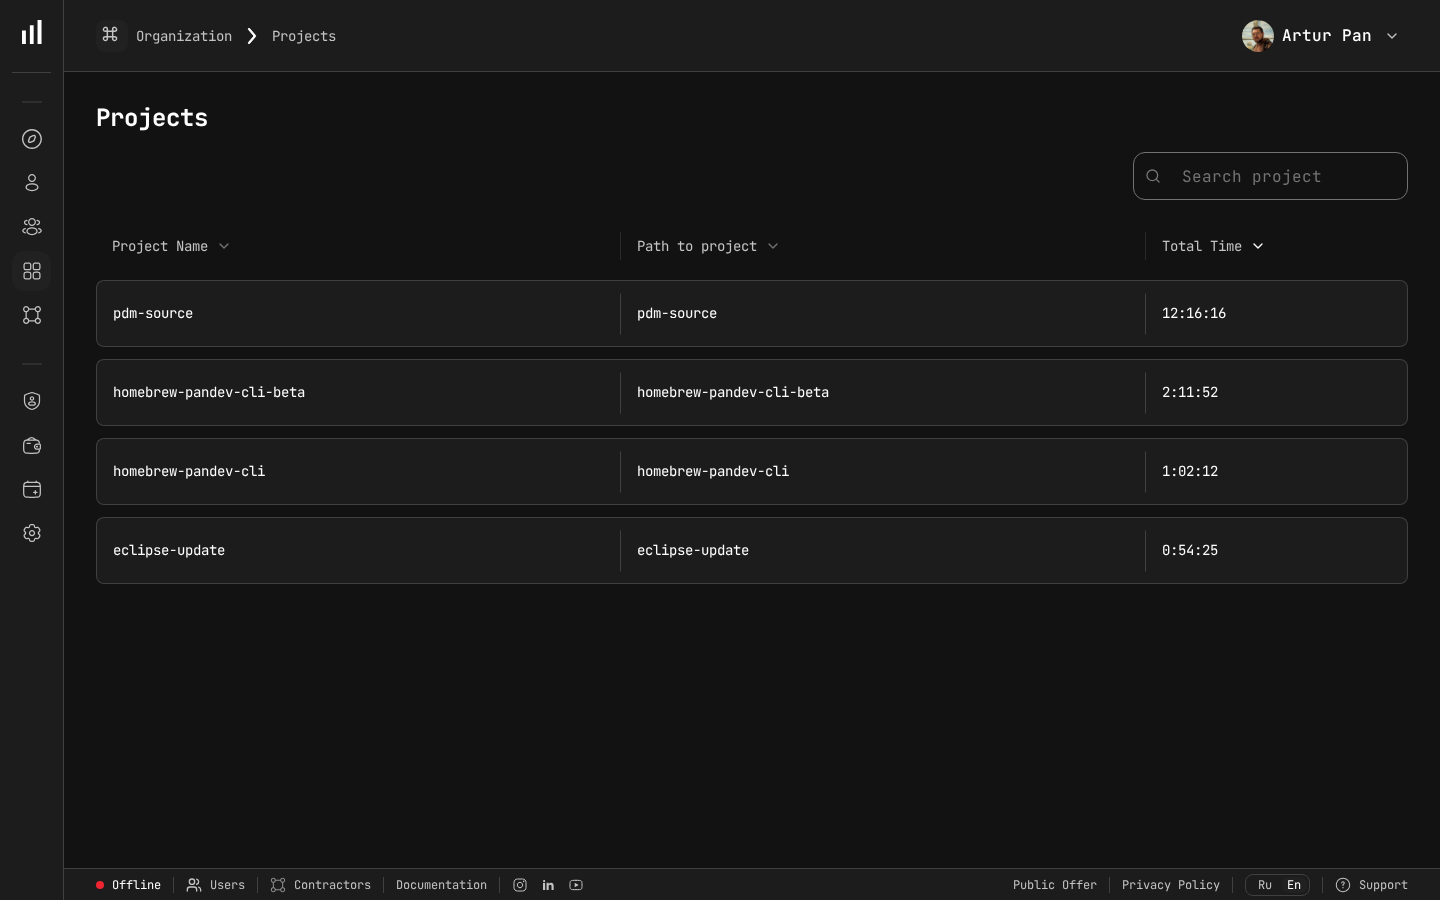
Project-level time tracking revealing cost distribution across the engineering portfolio.
The Starting Point: Understanding Where Money Goes
Before cutting costs, you need to know where the money is being spent. This sounds obvious, but most engineering organizations cannot answer the question with precision.
The CTO's first step was deploying automated activity tracking across the team. After 30 days of data collection, the picture became clear.
The Baseline: Where 35 Engineers Spent Their Time
| Activity | % of Total Time | Monthly Cost |
|---|---|---|
| New feature development | 38% | $296,400 |
| Bug fixes and regressions | 22% | $171,600 |
| Code reviews and waiting | 15% | $117,000 |
| Meetings and planning | 12% | $93,600 |
| Deployment and release process | 8% | $62,400 |
| Context switching / idle | 5% | $39,000 |
| Total | 100% | $780,000 |
The numbers told a story the CTO already suspected: only 38% of engineering cost went toward building new features. The rest — 62% — was overhead, rework, and process friction.
The question shifted from "who do we cut?" to "which of these categories can we shrink?"
Phase 1: Eliminate Rework (Months 1-2)
The Problem
Bug fixes and regressions consumed 22% of total engineering time — $171,600/month. That's over $2M per year spent fixing things that were already built.
The Investigation
Analyzing the bug data revealed patterns:
| Bug Source | % of Total Bugs | Avg. Fix Cost |
|---|---|---|
| Missing edge cases in original implementation | 35% | $1,800 |
| Integration issues between services | 28% | $3,200 |
| Regressions from unrelated changes | 22% | $2,100 |
| Environment-specific issues | 15% | $900 |
Integration bugs were the most expensive per incident. Missing edge cases were the most common. Regressions were the most preventable.
The Actions
Action 1: Introduce mandatory integration test coverage for inter-service calls. Cost to implement: 2 weeks of one senior engineer's time (~$7,600). Result: Integration bugs dropped 55% within two months.
Action 2: Expand automated regression test suite. Cost: 3 weeks across two QA engineers (~$9,900). Result: Regressions from unrelated changes dropped 60%.
Action 3: Implement structured code review checklist focused on edge cases. Cost: Essentially free — a document and a 30-minute team meeting. Result: Missing edge case bugs dropped 25%.
Phase 1 Results
| Metric | Before | After | Change |
|---|---|---|---|
| Bug fix time allocation | 22% | 13% | -9 points |
| Monthly bug fix cost | $171,600 | $101,400 | -$70,200 |
| Bug escape rate | 4.2 per sprint | 1.8 per sprint | -57% |
| Investment to achieve | $17,500 | One-time |
Monthly savings: $70,200 with a one-time investment of $17,500. Payback period: 8 days.
Phase 2: Reduce Review and Wait Time (Months 2-3)
The Problem
Code reviews and waiting consumed 15% of total time — $117,000/month. The data showed the issue wasn't the reviews themselves but the waiting between stages.
The Investigation
Using PanDev Metrics' 4-stage Lead Time breakdown, the team measured each phase:
Total Lead Time: 8.4 days average

├── Coding Time:        2.1 days (25%) ← actual work
├── Pickup Time:        2.8 days (33%) ← waiting for review
├── Review Time:        1.9 days (23%) ← actual review work
└── Merge-to-Deploy:    1.6 days (19%) ← waiting for deployment
A third of lead time was pure waiting — PRs sitting in a queue with no reviewer assigned. This wasn't just a time cost; it also caused context switching when developers came back to address review comments days later. The DORA State of DevOps Report consistently identifies review wait time as one of the key bottlenecks separating elite performers from the rest.
The Actions
Action 1: Implement review SLAs. Rule: Every PR must receive its first review within 4 business hours. Automated reminders ping reviewers after 3 hours. Result: Pickup time dropped from 2.8 days to 0.8 days.
Action 2: Limit PR size. Guideline: PRs should be under 400 lines of changed code. Larger changes must be split. Result: Review time dropped from 1.9 days to 1.1 days (smaller PRs are faster to review).
Action 3: Automate deployment pipeline. Investment: 3 weeks of DevOps engineering ($11,400). Result: Merge-to-deploy time dropped from 1.6 days to 0.3 days.
Phase 2 Results
| Metric | Before | After | Change |
|---|---|---|---|
| Average lead time | 8.4 days | 4.3 days | -49% |
| Review/waiting cost allocation | 15% | 9% | -6 points |
| Monthly review/waiting cost | $117,000 | $70,200 | -$46,800 |
| Deployment frequency | 8/month | 22/month | +175% |
Monthly savings: $46,800. The faster feedback loops also improved developer satisfaction — a benefit that's hard to quantify but real.
Phase 3: Optimize Meeting Culture (Months 3-4)
The Problem
Meetings and planning consumed 12% of engineering time — $93,600/month. The team averaged 11.2 hours of meetings per developer per week.
The Investigation
Not all meetings are waste. The team categorized their meetings:
| Meeting Type | Hours/Week/Dev | Value Assessment |
|---|---|---|
| Daily standup | 2.5h | Medium — too long |
| Sprint planning | 1.5h | High — necessary |
| Sprint retro | 1.0h | High — necessary |
| Cross-team syncs | 2.2h | Low — most are FYI |
| 1:1s with manager | 1.0h | High — necessary |
| Ad-hoc discussions | 3.0h | Mixed — some necessary |
Daily standups at 2.5 hours/week (30 min/day) were too long. Cross-team syncs were mostly status updates that could be async.
The Actions
Action 1: Cap standups at 10 minutes. Use async updates (Slack/written) for anything that needs discussion, then schedule focused follow-ups. Result: Standup time dropped from 2.5h to 1.0h/week.
Action 2: Replace cross-team syncs with async written updates. Monthly in-person syncs replaced weekly 30-minute calls. Result: Cross-team meeting time dropped from 2.2h to 0.5h/week.
Action 3: Implement "Maker's Schedule" — no-meeting blocks on Tuesday and Thursday mornings. Result: Ad-hoc meeting time dropped from 3.0h to 1.8h/week as people batched discussions.
Phase 3 Results
| Metric | Before | After | Change |
|---|---|---|---|
| Meeting hours per dev per week | 11.2h | 6.8h | -39% |
| Meeting cost allocation | 12% | 7.3% | -4.7 points |
| Monthly meeting cost | $93,600 | $56,940 | -$36,660 |
Monthly savings: $36,660 — and engineers got 4.4 more hours of focused work time per week.
Phase 4: Right-Size Resource Allocation (Months 4-6)
The Problem
With improved visibility into per-project costs, the CTO discovered that resource allocation was significantly misaligned with business priorities.
The Investigation
| Project | Business Priority | % of Eng Cost | Gap |
|---|---|---|---|
| Core Platform | Critical (70% of revenue) | 30% | Under-invested |
| New Market Product | High (growth bet) | 15% | Appropriate |
| Internal Tools | Medium | 25% | Over-invested |
| Legacy System | Low (sunset in 6 months) | 20% | Over-invested |
| Misc / unattributed | N/A | 10% | Unknown |
25% of engineering cost going to internal tools was disproportionate. 20% going to a system being sunset in 6 months was clearly wasteful.
The Actions
Action 1: Reduce legacy system team from 7 to 3 engineers. Move 4 engineers to the core platform team. Remaining 3 handle critical maintenance only.
Action 2: Consolidate internal tools effort. Replace two custom internal tools with off-the-shelf solutions. Reduce internal tools team from 9 to 5 engineers.
Action 3: Redirect freed-up capacity to Core Platform and New Market Product.
Note: No one was laid off. Engineers were reassigned to higher-priority projects where their skills were needed.
Phase 4 Results
| Metric | Before | After |
|---|---|---|
| Core Platform investment | 30% | 45% |
| Legacy System cost | $156,000/mo | $54,000/mo |
| Internal Tools cost | $195,000/mo | $90,000/mo |
| Revenue from Core Platform | grew 12% in 2 months |
Monthly savings from reallocation: $102,000 (the savings are real even though headcount didn't change — the same cost produced higher-value output).
The Combined Result: 6 Months Later
| Optimization Area | Monthly Savings | % of Total Savings |
|---|---|---|
| Rework elimination | $70,200 | 29% |
| Review/wait time reduction | $46,800 | 19% |
| Meeting optimization | $36,660 | 15% |
| Resource reallocation | $102,000 | 42% |
| Total monthly savings | $240,000 |
Original monthly cost:  $780,000
Optimized monthly cost: $540,000
Reduction:              $240,000 (30.7%)
Annualized savings: $2.88M
And the quality metrics? They improved:
| Quality Metric | Before | After |
|---|---|---|
| Bug escape rate | 4.2/sprint | 1.8/sprint |
| Deployment frequency | 8/month | 22/month |
| Lead time | 8.4 days | 4.3 days |
| Customer-reported incidents | 12/month | 5/month |
The 30% cost reduction came from eliminating waste and friction, not from reducing capacity or cutting corners.
Forbes Kazakhstan reports similar findings across the industry: "Results showed a 30% productivity increase, while release quality improves by 25%." — Forbes Kazakhstan, April 2026
The Playbook: How to Replicate This
Prerequisites
- Automated activity tracking — you cannot optimize what you cannot measure. Deploy IDE tracking across the team.
- Hourly rate data — set up individual or role-based loaded hourly rates so you can convert time into money.
- Project mapping — ensure every repository and branch maps to a project or cost center.
- Lead time breakdown — you need to see where time is spent across the delivery pipeline, not just total cycle time.
Sequence
Month 1: Deploy tracking, collect baseline data. Do not make changes yet — just observe.
Month 2: Analyze the data. Identify the top 3 cost categories that can be reduced. Start with the quickest wins (usually rework elimination and meeting optimization).
Month 3-4: Implement changes. Measure the impact weekly.
Month 5-6: Tackle resource allocation — this takes longer because it involves team restructuring, but it often produces the largest savings.
What Not to Do
- Don't cut headcount as step 1. You'll lose institutional knowledge and likely just shift the remaining work to slower, more expensive contractors later.
- Don't use cost data to micromanage. Developers who feel surveilled will game the metrics or leave.
- Don't expect overnight results. Rework reduction takes a few sprints to show up. Meeting culture changes take weeks to stick.
- Don't ignore quality metrics. If bug rates or customer incidents increase, your cost reduction is actually a cost shift to the future.
How PanDev Metrics Supports This Process
Each phase of the cost optimization playbook requires specific data. PanDev Metrics provides:
- Automated time tracking (10+ IDE plugins) — baseline activity data without manual logging
- Financial analytics with hourly rates — convert developer time into actual costs per project, team, and feature
- 4-stage Lead Time breakdown — identify where time is wasted in the delivery pipeline
- DORA metrics — track deployment frequency, lead time, and failure rate to ensure quality isn't degrading
- AI assistant — surface optimization opportunities from your data
- On-premise deployment — keep all financial and activity data within your infrastructure
The cost of not knowing is always higher than the cost of tracking. When you can see exactly where $780K per month goes, the path to $540K becomes visible.
Key Takeaways
- Measure before you cut — 30 days of automated tracking reveals where the real waste is
- Rework is the lowest-hanging fruit — fixing your quality processes saves money immediately
- Wait time is hidden cost — developers waiting for code reviews is expensive idle capacity
- Meeting culture is a cost lever — every unnecessary meeting hour costs $75-120 per person
- Resource reallocation beats layoffs — moving people to higher-priority work produces more value without reducing capacity
- 30% savings is achievable — but it takes 4-6 months of sustained, data-driven effort
Want to find the waste hidden in your engineering spend? PanDev Metrics gives you the visibility to optimize delivery costs with data, not guesswork.