Datadog vs Honeycomb in 2026: Observability Platforms Compared

The observability market crossed $5 billion in annual revenue in 2025 and is on track for another double-digit growth year in 2026. Two of the loudest names, Datadog and Honeycomb, sit at opposite philosophical poles. Datadog wants to be the single pane of glass for everything that breathes in your cluster. Honeycomb argues that "everything" is a trap, and that a single wide event per request beats three pillars stitched together with correlation IDs. Both are right about something. Neither is right about everything.
{/* truncate */}
Quick TL;DR
Datadog — broad, agent-based monitoring platform with 700+ integrations, deep dashboards, and an enterprise-grade ML/AI surface. Built for breadth.
Honeycomb — events-first observability built around structured wide events, BubbleUp anomaly detection, and a query engine tuned for high-cardinality debugging. Built for depth.
The choice isn't really about features. It's about whether you debug from a dashboard or from a query.
Data model difference, and why it actually matters
Datadog inherited the classic three pillars model: metrics, logs, and traces. Each lives in its own subsystem with its own retention, indexing, and pricing rules. Correlation between them happens via tags (service, env, version) and trace IDs. It works well for "is the host healthy?" questions. It works less well for "why did p99 spike for users on tenant=acme on iOS 17 in São Paulo between 14:02 and 14:07?"
Honeycomb's foundational bet, articulated by co-founder Charity Majors in Observability Engineering (O'Reilly, 2022), is that one wide structured event per request, with hundreds of fields including business context, collapses the three pillars into a single substrate. You stop joining metrics to logs to traces. You query the event store.
The practical consequence: high-cardinality questions (group by user_id, tenant_id, feature_flag_variant) are first-class in Honeycomb. In Datadog, the same questions either require custom metrics (priced separately, easy to blow the budget) or indexed log queries (priced per GB ingested AND per indexed event).
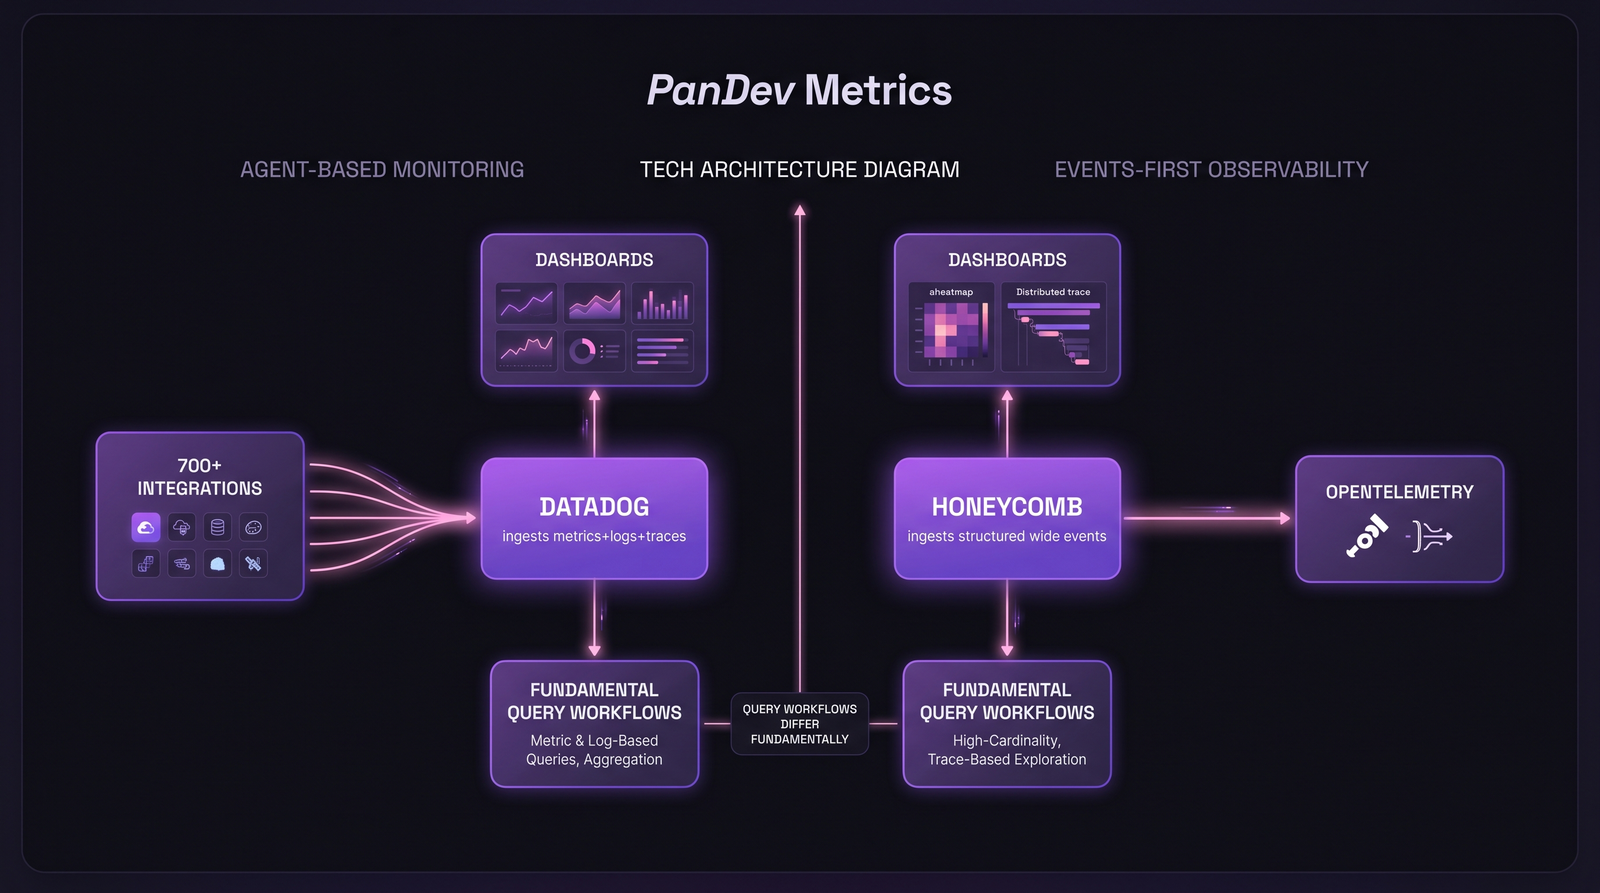 Same incident, two query workflows. The choice of data model shapes how your engineers think about a problem.
Datadog in 2026
Where Datadog wins
- Breadth of integrations. 700+ official integrations as of early 2026, covering everything from AWS and Kubernetes to Snowflake, Stripe, and Zendesk. If a vendor exists, an integration probably does too.
- Pre-built dashboards. Setup is fast. Install the agent, point it at a service, get a dashboard within an hour.
- Watchdog & Bits AI. Datadog's ML-driven anomaly detection has matured. Watchdog finds outliers without explicit thresholds; Bits AI (the 2024 launch) lets engineers ask natural-language questions and get explanations from incident context.
- Enterprise checkbox coverage. SOC 2 Type II, HIPAA, FedRAMP Moderate, on-prem-friendly via private link, role-based access at scale.
Where Datadog hurts
- Pricing scales hard. The 2024 financial reports show Datadog crossed $2.6B in annual revenue with 28% YoY growth. That growth is coming from somewhere, and "somewhere" is your invoice. Per-host APM, indexed logs, custom metrics, RUM, CI Visibility, and synthetics each have their own meter.
- Indexed logs gotcha. Logs ingested ≠ logs indexed. Unindexed logs are cheap, but you can't query them at full speed. The first time SRE needs to debug a production fire against three weeks of "archived" logs, the rehydration bill arrives.
- Custom metrics tax. Every unique tag combination is a custom metric. A team that adds
tenant_idto a histogram and serves 5,000 tenants just created 5,000 custom metrics. Datadog will price them at roughly $0.05 each per month, plus burst overage. Easy to misjudge. - Agent overhead. Multiple customer-reported benchmarks put the Datadog agent at 1–3% CPU per host under load. Not crippling, but not free, and visible in tight container budgets.
ICP for Datadog
Mid-market to enterprise companies with a heterogeneous stack, a dedicated SRE/observability function, and a budget that can absorb the meter. If you want one tool that answers "is everything OK?" across 40 services without writing queries, Datadog earns its price.
Honeycomb in 2026
Where Honeycomb wins
- Query speed on trace data. Honeycomb's columnar event store is built for fast aggregations over high-cardinality fields. Customer reports and Honeycomb's own benchmarks consistently land queries on hundreds of millions of events in under 10 seconds.
- BubbleUp. Pick a slow region of your latency heatmap, click, and Honeycomb shows you which field values differ between the slow events and the baseline. It's the single feature that changes how engineers debug. Fewer "let me check 12 dashboards", more "show me what's different about these requests."
- OpenTelemetry-native. Honeycomb was an early OTel sponsor and the company stack assumes OTel SDKs as the default ingestion path. No proprietary agent required. According to the CNCF Annual Survey 2024, 68% of organizations are now using or evaluating OpenTelemetry. Honeycomb's bet is paying off.
- Predictable pricing. Honeycomb prices on events ingested with a fixed retention. There's no per-host meter, no indexed-vs-unindexed gotcha, no custom metric multiplier. You can model your bill three months out.
Where Honeycomb hurts
- Steeper learning curve. Dashboards aren't free. You write queries. Engineers raised on Datadog's pre-built screens sometimes bounce off the "blank canvas" of Honeycomb's query builder for a week before it clicks.
- Fewer turnkey integrations. No agent ecosystem with 700 connectors. If you want metrics from a SaaS vendor that doesn't speak OTel, you bridge it yourself.
- Logs are second-class. Honeycomb can ingest logs as events, but it's not a log management platform. Teams running 50 TB/day of unstructured stdout will still need Loki, ClickHouse, or yes, Datadog Logs alongside.
- Smaller community + docs corpus. Datadog Q&A is everywhere. Honeycomb's community is more concentrated and more expert, but you'll Google less and read official docs more.
ICP for Honeycomb
Engineering organizations that own their services end-to-end, ship multiple times a day, and accept that observability is a discipline, not a procurement. Strong fit for product engineering teams where developers write queries themselves rather than handing tickets to an SRE.
Side-by-side: where the platforms actually differ
| Dimension | Datadog | Honeycomb |
|---|---|---|
| Data model | Metrics + Logs + Traces (3 pillars) | Wide structured events (single substrate) |
| OpenTelemetry support | Supported, but agent-first | Native, primary ingestion path |
| Query language | Tag-based, GUI + log queries (DDSQL beta) | Custom (no SQL); GUI-driven with BubbleUp |
| AI / ML features | Watchdog anomaly detection, Bits AI assistant | Anomaly detection via BubbleUp + Query Assistant (LLM-backed query builder) |
| Pricing model | Per-host (APM), per-GB (logs), per-custom-metric, per-RUM-session | Per-event ingested, predictable tiers |
| On-prem option | Private SaaS / data residency, no full on-prem | No (cloud-only) |
| Learning curve | Low for dashboards, high for cost optimization | Medium-high for queries, low for cost prediction |
| Integrations | 700+ official | OTel ecosystem + native integrations (fewer in count, broader in protocol) |
| High-cardinality debug | Possible but expensive (custom metrics) | Native and core (BubbleUp) |
Query benchmarks: how fast does "show me the anomaly" return?
Public benchmarks for both platforms are noisy because workloads vary wildly. Honest framing of what customers report:
| Query type | Honeycomb (typical) | Datadog (typical) |
|---|---|---|
| Group by 4 fields over 1B events | 3–8 seconds | Requires indexed logs or custom metrics setup; sub-10s if pre-aggregated, minutes-to-hours if rehydrating archived logs |
| Heatmap of latency by service for 24h | < 5 seconds | < 5 seconds (with APM data already indexed) |
| BubbleUp anomaly cause for 100M events | 5–15 seconds | No direct equivalent; closest is Watchdog Insights, which surfaces async findings |
Trace search on tenant_id=acme with 5,000 active tenants | < 10 seconds (events native) | Requires tenant_id to be a custom dimension or indexed log field; otherwise slow |
The honest limit: these numbers are public list pricing + customer-reported. Real enterprise contracts vary 2-5x depending on commitment, region, and negotiation. Don't treat the table as a procurement document.
Pricing: where the costs hide
Datadog
Public list prices (per-host, per-month, annual commitment, May 2026):
| Module | Price | Hidden risk |
|---|---|---|
| Infrastructure Pro | $15/host | Containers count toward host limits in dense K8s deployments |
| APM | $31/host | Distributed tracing without log correlation is half the value |
| Log Management | $0.10/GB ingested + $1.06–$2.50 per million indexed events | Indexed event tier matters more than GB; surprise bills come from log volume spikes during incidents |
| Custom Metrics | First 100 free, then $0.05/metric/month | High-cardinality tags multiply this fast |
| RUM | $1.50 per 1k sessions | Mobile + web counted separately |
For a 50-host production environment with APM, logs (1 TB/month, 10% indexed), and 10,000 custom metrics: ballpark $8,000–$12,000/month. Pre-paid commits drop this 20-30%.
Honeycomb
Public list prices (May 2026):
| Plan | Price | Includes |
|---|---|---|
| Free | $0 | 20M events/month, 60-day retention |
| Pro | Starts ~$130/month per team | Custom event volume, 60-day retention, BubbleUp, Query Assistant |
| Enterprise | Custom | SSO, audit logs, dedicated support, longer retention |
For a comparable engineering workload (~1B events/month, ~50 services), enterprise contracts commonly land in the $3,000–$8,000/month range. Sometimes lower if you don't need RUM or extensive log management on the side.
The trap: Honeycomb-only teams often still pay for some log management elsewhere. Datadog-only teams often pay 3x what they budgeted because of custom metric and indexed log overruns. Neither bill is what the vendor's pricing page suggests.
When to pick which
Pick Datadog if:
- You're an enterprise running heterogeneous infrastructure (AWS + Azure + on-prem + 50 SaaS vendors) and need a single dashboard surface for an exec team
- You're not yet on OpenTelemetry and don't want to migrate instrumentation
- Compliance requires extensive pre-built audit dashboards (PCI, HIPAA, SOC 2)
- Your SRE team is structured around "operate the platform" and uses dashboards more than queries
Pick Honeycomb if:
- Your engineers write queries to debug their own services (DevOps maturity is high)
- You're already invested in OpenTelemetry SDKs
- High-cardinality fields (tenant, user, feature flag, region) are critical to debugging
- Predictable observability spend matters more than absolute breadth
- You ship multiple times a day and care about "what changed?" more than "what's the average?"
Pick both (small but growing pattern in 2026): Datadog for infrastructure & log volume, Honeycomb for application-level observability where engineers actually debug. The combined bill is higher than either alone, but the tools complement rather than duplicate. Several Series-C-plus engineering teams have publicly described this split.
The contrarian claim
The conventional wisdom: Datadog is the "expensive enterprise choice" and Honeycomb is the "fancy observability for those who can afford it." Reality from customer accounts in 2026: most SREs discover Datadog as cheap-as-agent-monitor quietly becomes expensive-when-debugging the moment they need unindexed log queries or high-cardinality custom metrics. Meanwhile Honeycomb, marketed as the premium option, often comes in cheaper for high-cardinality workloads because events-based pricing doesn't punish you for adding dimensions.
The price you see on the website isn't the price you pay. The price you pay depends on what you debug.
How PanDev Metrics fits next to observability
PanDev Metrics is not an observability tool. It doesn't replace Datadog or Honeycomb and doesn't try to. What it does: pull incident and deployment data from your PagerDuty (or equivalent) and Git providers, and compute DORA metrics (including MTTR, change failure rate, and deployment frequency) across teams and services. The boundary is clear: Datadog/Honeycomb tell you "what is broken right now." PanDev tells you "how often things break, how long they take to fix, and which teams own which incidents." Most engineering organizations need both, and they integrate cleanly.
For more on how MTTR sits inside the broader DORA picture, see our piece on MTTR — the speed of recovery. For the observability data model itself, the observability stack for engineering teams and Kubernetes observability go deeper.
FAQ
Is Honeycomb cheaper than Datadog?
For high-cardinality application workloads, often yes. Events-based pricing doesn't multiply with dimensions. For broad infrastructure monitoring across hundreds of hosts and SaaS vendors, Datadog can be cheaper because Honeycomb doesn't replace log management. Run both pricing models against your actual telemetry volume before deciding.
Can I use OpenTelemetry with both Datadog and Honeycomb?
Yes. Both support OTel. Honeycomb treats OTel as the primary path; Datadog supports OTel but its agent-based collectors and proprietary protocols are still the more mature route. If OTel portability matters for vendor lock-in concerns, Honeycomb is the safer bet.
Which is better for small teams: Datadog or Honeycomb?
For teams under 20 engineers shipping a focused application stack: Honeycomb's free tier (20M events/month) plus Pro often covers everything observability-related without breaking budget. Datadog's free tier exists but the meter starts immediately for any meaningful telemetry. Caveat: small teams running a wide SaaS-vendor stack might still prefer Datadog's pre-built integrations to writing OTel exporters manually.
Which has better AI features in 2026?
Datadog's Bits AI is more mature as a generalist assistant. It correlates incidents, summarizes alerts, and integrates with their broader product surface. Honeycomb's Query Assistant is narrower but excellent at the specific job of "turn my English question into a Honeycomb query." Neither has replaced an experienced SRE; both speed up onboarding for new engineers significantly. For our take on the broader trend, see the AI copilot effect on engineering work.
Can I migrate from Datadog to Honeycomb easily?
It depends on what instrumentation you've adopted. If you're already on OpenTelemetry SDKs (or willing to migrate from Datadog's dd-trace libraries to OTel), the data layer is portable. The hard part isn't ingestion. It's retraining engineers from dashboard-first to query-first. Plan for a quarter of overlap, not a weekend cutover. Practices for managing this kind of transition without burning out the team are covered in on-call rotation best practices and incident postmortem templates.
What to actually expect
Pick the tool that matches how your engineers want to debug, not the tool that wins the feature matrix on a Gartner slide. Datadog is excellent at "what does my infrastructure look like" and painful at "why did this one user hit a 500." Honeycomb is excellent at the second question and weaker on the first. Most teams that pick poorly are matching a tool to their CFO's preference rather than their on-call engineer's workflow, and the cost shows up six months later as either a budget overrun or a slow incident.