Delivery Index: How to Measure Development Velocity Without Lines of Code

Fred Brooks warned in The Mythical Man-Month (1975) that measuring programmer productivity by volume of code is a trap: adding more code isn't the same as adding more value. Fifty years later, some organizations still equate lines written with work done. The SPACE framework (Forsgren et al., 2021) explicitly cautions against single-dimensional activity metrics — yet the need they address is real: how do you measure whether your engineering team is delivering?
The answer isn't another vanity metric. It's a composite signal we call the Delivery Index.
{/* truncate */}
Why Lines of Code Failed
Lines of code (LoC) as a productivity metric has been criticized for decades, and for good reason. Let's start with the obvious problems:
| Scenario | Lines of code | Actual value delivered |
|---|---|---|
| Developer refactors 3,000 lines into 800 | −2,200 | High — simpler, faster, fewer bugs |
| Junior copies Stack Overflow answer | +500 | Low — untested, poorly integrated |
| Senior designs clean API | +120 | Very high — enables 5 other developers |
| Developer adds logging everywhere | +2,000 | Low — noise, performance impact |
LoC penalizes good engineering. A senior developer who spends a week designing an elegant 200-line solution appears "less productive" than a junior who writes 2,000 lines of spaghetti. The metric rewards verbosity, not value.
But the deeper problem is incentive distortion
When you measure LoC, developers write more code. They copy-paste instead of abstracting. They avoid refactoring because it reduces their "score." They add unnecessary complexity. The metric doesn't just fail to measure productivity — it actively makes your codebase worse.
Bill Gates reportedly said: "Measuring software productivity by lines of code is like measuring progress on an airplane by how much it weighs." Whether he actually said it is debatable. Whether it's true is not.
What the VP of Engineering Actually Needs
When a VP of Engineering asks "are we delivering?", they're really asking several questions at once:
- Are developers actively working on the right things? (Activity)
- Are tasks and features actually getting completed? (Throughput)
- Is the pace sustainable and consistent? (Consistency)
- Are estimates improving over time? (Predictability)
No single metric answers all four. That's why we built Delivery Index as a composite metric that considers multiple signals.
How Delivery Index Works
Delivery Index in PanDev Metrics is calculated from several weighted components:
| Component | What it measures | Why it matters |
|---|---|---|
| Activity Time | Hours of active IDE coding time | Shows effort input — is the developer actually coding? |
| Focus Time | Sustained uninterrupted sessions | Quality of effort — fragmented vs. deep work |
| Task velocity | Tasks completed per time period | Output signal — are things getting done? |
| Consistency score | Variance in daily/weekly output | Sustainability — steady pace vs. boom-bust cycles |
| Planning accuracy delta | Estimated vs. actual completion | Predictability — can the team forecast reliably? |
The Delivery Index produces a normalized score that accounts for the reality of software development: some weeks are heavy coding weeks, some are architecture and planning weeks. A healthy Delivery Index doesn't require maximum coding every day — it requires consistent, predictable delivery.
The math in plain English
Think of Delivery Index like a credit score. No single factor determines it. A developer who codes 4 hours daily but never finishes tasks has a mediocre Delivery Index. A developer who codes 1 hour daily but consistently ships features on schedule scores well. The metric rewards completed work delivered predictably — not raw activity.
What Our Data Reveals About Velocity
Analyzing data from B2B engineering teams using PanDev Metrics, we see clear patterns in how healthy delivery looks — patterns that align with McKinsey's 2023 finding that developers spend only 25-30% of their time writing code:
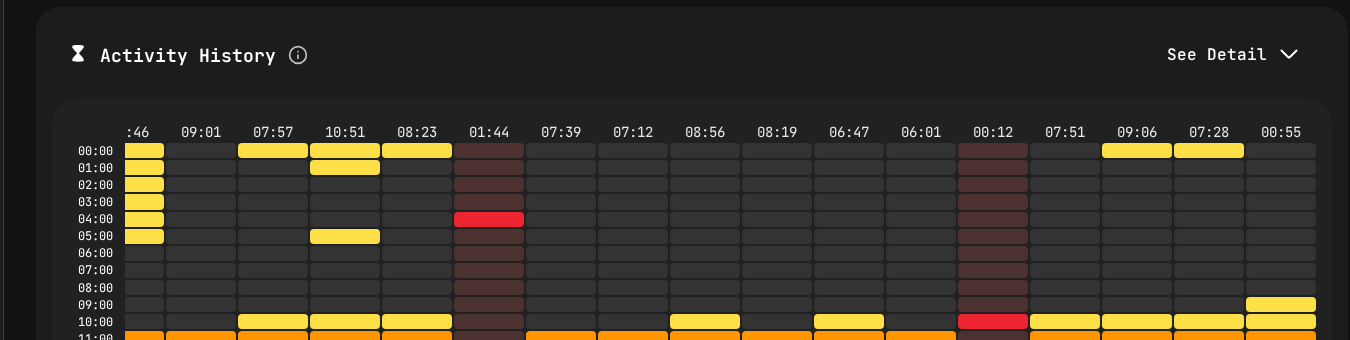
Activity heatmap showing real coding patterns — the data behind Delivery Index.
Coding time is not the bottleneck you think it is
The median developer in our dataset codes 78 minutes per day. The mean is 111 minutes. This means the "typical" developer spends roughly 1.5 hours in active coding.
| Coding time bucket | % of developers | Avg. Delivery Index |
|---|---|---|
| < 30 min/day | 12% | Low — often blocked or in too many meetings |
| 30–60 min/day | 21% | Medium — common for senior roles with review duties |
| 60–120 min/day | 32% | High — the sweet spot for most IC roles |
| 120–180 min/day | 9% | High — strong individual contributors |
| 180+ min/day | 27% | Varies — sometimes high velocity, sometimes burnout signal |
The sweet spot is 60-120 minutes of coding per day with a high Delivery Index. Developers in this range tend to code efficiently, complete tasks on schedule, and maintain a sustainable pace. Going above 180 minutes daily doesn't consistently correlate with better delivery — in some cases, it signals thrashing or rework.
IDE choice and velocity
Our data shows interesting patterns across the three dominant IDEs:
| IDE | Users | Total hours | Avg. hours/user |
|---|---|---|---|
| VS Code | 100 | 3,057 | 30.6 |
| IntelliJ IDEA | 26 | 2,229 | 85.7 |
| Cursor | 24 | 1,213 | 50.5 |
IntelliJ users show higher average hours per user — likely reflecting that Java (our #1 language at 2,107 hours) is primarily developed in IntelliJ, and Java projects tend to require more typing due to the language's verbosity. This is exactly why LoC doesn't work: a Java developer writing 200 lines has done less "work" than a Python developer writing 50 lines of equivalent logic.
Five Anti-Patterns That Kill Delivery
When Delivery Index drops across a team, it's usually caused by one of these patterns:
1. The estimation death spiral
Teams consistently underestimate tasks → they miss deadlines → managers add buffer → estimates become meaninglessly large → planning accuracy drops → nobody trusts the roadmap.
Delivery Index signal: Planning accuracy component drops below 50%, task velocity stays flat or declines.
2. The meeting tax
A developer with 4 hours of meetings has, at best, 4 hours of fragmented time remaining. With context switching overhead, this yields maybe 45 minutes of actual Focus Time.
Delivery Index signal: Activity Time drops while task assignments stay constant. The developer is "busy" but not coding.
3. The hero dependency
One senior developer is the bottleneck for all code reviews, architecture decisions, and debugging sessions. Their Delivery Index may look fine, but the team's aggregate drops because everyone is waiting on them.
Delivery Index signal: One developer shows high Activity Time with low task velocity (they're helping others, not shipping their own work). Team-level Delivery Index declines despite individual effort.
4. The scope creep silent killer
Tasks keep growing after estimation. A "2-day feature" becomes a "2-week epic" through accumulated changes. The work gets done, but it doesn't match what was planned.
Delivery Index signal: Task velocity drops dramatically while coding time stays constant or increases. Developers are working hard on tasks that never close.
5. The tech debt avalanche
The codebase is so fragile that every new feature requires fixing three things first. Development feels slow not because developers are slow, but because the environment resists change.
Delivery Index signal: High Activity Time, high Focus Time, low task velocity. Developers are coding intensely but progress is minimal — a clear sign of codebase friction.
How to Implement Delivery Index in Your Organization
Step 1: Establish a baseline (Week 1-2)
Deploy IDE tracking across your team. PanDev Metrics supports VS Code, all JetBrains IDEs, Cursor, Visual Studio, and more. Let data collect for at least two full sprints before drawing conclusions.
Step 2: Identify patterns, not outliers (Week 3-4)
Look at team-level trends first:
| What to look for | Healthy signal | Warning signal |
|---|---|---|
| Daily coding time distribution | 60–120 min median | Bimodal (< 30 or > 240) |
| Day-over-day consistency | Low variance | Boom-bust cycles |
| Task completion trend | Steady or improving | Declining week-over-week |
| Estimation accuracy | Within ±30% | Consistently off by 2x+ |
Step 3: Address systemic issues (Month 2)
Use the data to make structural changes: reduce meeting load, rebalance work across the team, break down oversized tasks, or allocate time for tech debt reduction.
Step 4: Track improvement (Ongoing)
Delivery Index should trend upward as you remove friction. If it doesn't, you're solving the wrong problems.
Delivery Index vs. DORA Metrics
DORA metrics (Deployment Frequency, Lead Time, Change Failure Rate, Mean Time to Recovery) measure the delivery pipeline. Delivery Index measures the development process that feeds the pipeline.
| Dimension | DORA | Delivery Index |
|---|---|---|
| What it measures | CI/CD pipeline health | Developer and team work patterns |
| Granularity | Team/service level | Individual + team level |
| Leading/lagging | Mostly lagging (measures output) | Leading (measures conditions for output) |
| Data source | Git, CI/CD systems | IDE activity, task management |
| Best for | DevOps maturity | Engineering management |
They're complementary. DORA tells you how fast your pipeline ships. Delivery Index tells you how effectively your team develops. Poor Delivery Index will eventually show up as degraded DORA metrics — but by then, you've lost weeks.
What to Tell Your Board
VPs of Engineering often need to translate engineering metrics into business language. Here's how Delivery Index maps to business outcomes:
- High Delivery Index + High Planning Accuracy → "We ship what we promise, when we promise it."
- High Delivery Index + Low Planning Accuracy → "We're delivering well, but our estimates need work. Roadmap dates have uncertainty."
- Low Delivery Index + High Activity → "The team is working hard but there are structural blockers — tech debt, dependencies, or process overhead."
- Low Delivery Index + Low Activity → "We have a staffing, engagement, or tooling problem."
The value of Delivery Index isn't the number itself — it's the conversation it enables. Instead of "are we productive?", you can ask "what's blocking delivery?" and have data to guide the answer.
Based on aggregated data from PanDev Metrics Cloud (April 2026), thousands of hours of IDE activity across B2B engineering teams. All data anonymized and aggregated. References: SPACE framework (Forsgren et al., ACM Queue, 2021); Fred Brooks, "The Mythical Man-Month" (1975); McKinsey developer productivity report (2023).
Want to see your team's Delivery Index? PanDev Metrics calculates it automatically from IDE activity and task data — no manual tracking, no timesheets, no guesswork.