Deployment Frequency: The DORA Metric Explained

Elite engineering teams deploy 973 times more often than low performers, and break production less often. That's the DORA 2023 State of DevOps finding that broke a decade of "move fast and break things" assumptions: speed and stability are correlated, not traded.
Deployment Frequency is the simplest of the four DORA metrics on the surface, and the most misread. A team can deploy ten times a day to staging, never ship to prod, and still call themselves "elite". This glossary fixes that: formula, benchmarks, what counts as a deploy, and the failure modes that make the number lie.
{/* truncate */}
Deployment Frequency: the DORA definition
Deployment Frequency (DF) is one of the four metrics defined by the DevOps Research and Assessment (DORA) team at Google Cloud. It measures how often an organization successfully releases code to production.
The metric was popularized by Nicole Forsgren, Jez Humble, and Gene Kim in Accelerate (2018), where they showed that high deployment frequency correlates with profitability, market-share growth, and lower employee burnout, not just engineering output. The 2023 State of DevOps Report, built on 36,000+ respondents over ten years, has confirmed the pattern in every annual cohort since.
DF is the throughput half of DORA. Paired with Lead Time for Changes, it tells you how fast value moves from "merged" to "running for users". Stability is measured separately by Change Failure Rate and MTTR. See the full DORA guide for how the four metrics interact.
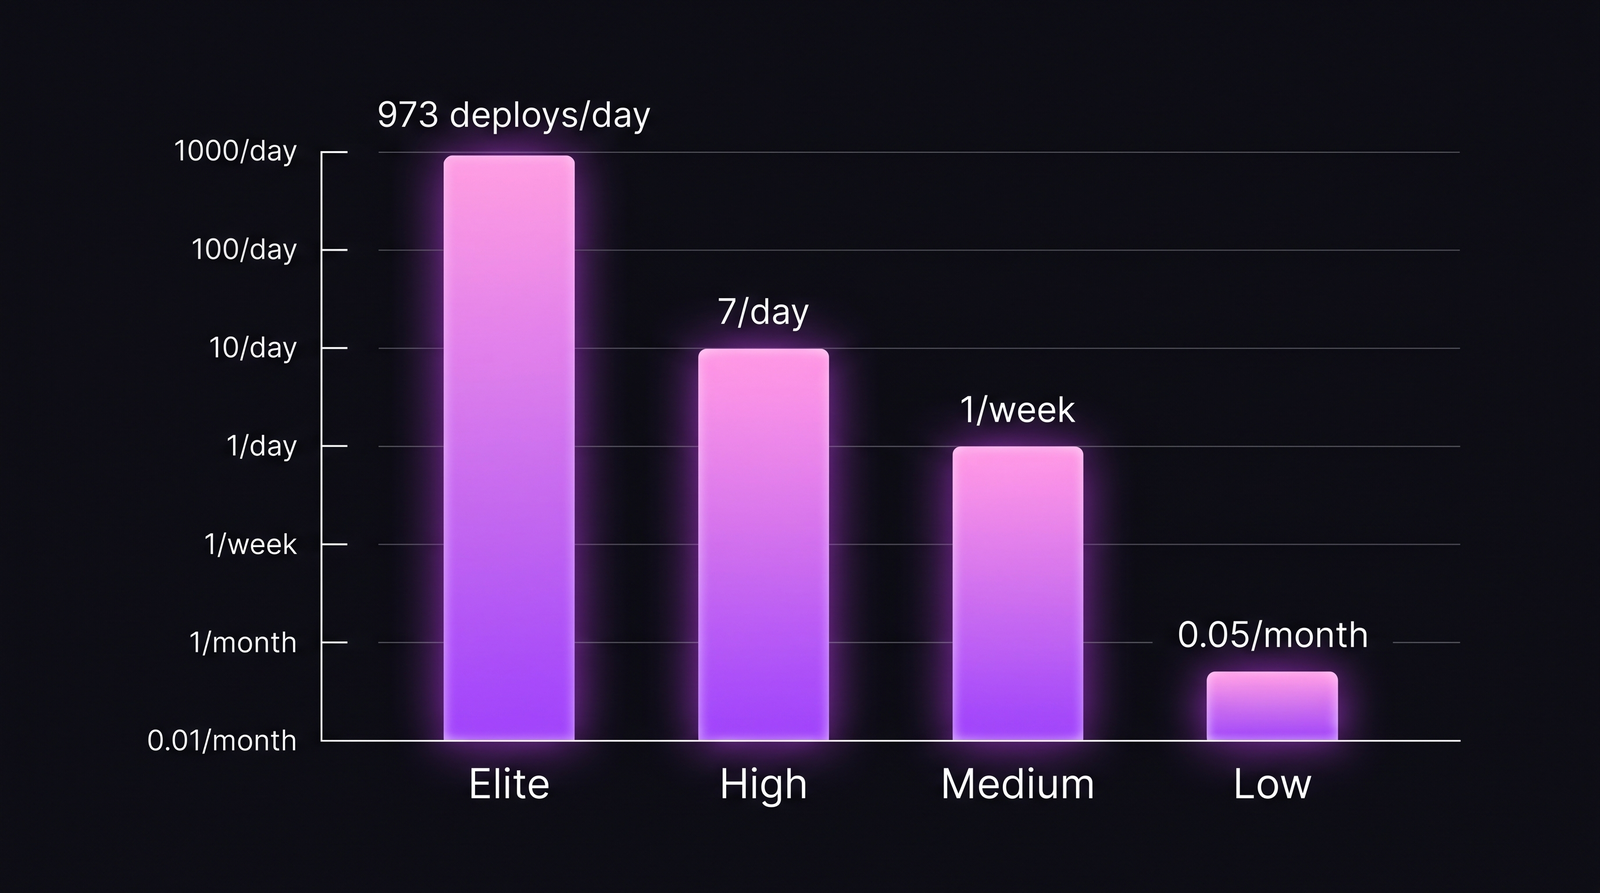 Order-of-magnitude gap between performance tiers. DORA 2023 cohort.
The formula
Deployment Frequency = Successful production deployments ÷ Time window
Pick one time window and stick to it. The window depends on tier:
| Cadence | Reporting window | Read as |
|---|---|---|
| Multiple/day | Daily or weekly | "12 deploys/day median" |
| Daily | Weekly | "~5/day, 25/week" |
| Weekly | Monthly | "4-5 deploys/month" |
| Monthly or less | Quarterly | "2 deploys/quarter" |
Two practical rules:
- Median, not mean. One CI-storm day with 40 deploys skews a monthly average. Use the median deploys-per-day across business days.
- Successful only. A failed pipeline that never reached production isn't a deployment. Include rolled-back deploys (they did reach prod) but exclude aborted runs.
What counts as a "deploy"
This is where the metric breaks down for half the teams measuring it.
Only production counts. Staging, QA, preview environments: none of these are deployments for DORA. Useful internal signals, but the official metric is about code reaching users.
One deploy per release event, not per change. If a release ships 12 merged PRs at once, that's one deploy, not 12.
Multi-service complications. A microservices org deploying 80 services independently can report 80x the deploys of a monolith team shipping the same feature. DORA and Forsgren's later work suggest reporting DF per deployable artefact or per team, not as a global org count that rewards splitting.
| Scenario | Counts as |
|---|---|
Push to main → auto-deploy to prod, success | 1 deploy |
| Same as above, but pipeline failed at smoke test | 0 deploys |
Push to main → deploy to staging only | 0 deploys |
| Rolling release across 5 prod regions | 1 deploy (one release) |
| 12 PRs merged, batched into one release | 1 deploy |
| Hotfix pushed straight to prod | 1 deploy |
Benchmarks 2026
The DORA 2023 report defines four performance tiers. The 2024 update preserved them, and 2026 cohorts I've seen at PanDev Metrics customers match closely, though the "elite" line has crept upward at hyperscale companies.
| Tier | Deployment Frequency | Typical org type |
|---|---|---|
| Elite | On-demand, multiple per day | Trunk-based, full CD, feature flags |
| High | Once per day to once per week | Mature CI/CD, weekly release train |
| Medium | Once per week to once per month | Manual approval gates, release windows |
| Low | Less than once per month | Long-lived feature branches, batched releases |
Amazon's reported peak (~50M deploys/year across services in 2015, ~1.5/second) and Netflix's continuous deployment numbers are outliers, not aspirational targets. For a 20-person product team, 3-5 production deploys per business day is a strong elite signal.
A contrarian point worth holding: measuring "deploys per day" in a team that doesn't practice trunk-based development is mostly noise. Long-lived feature branches inflate the metric when they finally merge in bursts and depress it when they're stuck. DF as a leading indicator only works if your branching model lets it.
Why more deploys mean fewer outages (the counter-intuitive part)
The default mental model is: more changes = more risk. The DORA data says the opposite. Why?
Smaller change sets. A deploy with 2 PRs has fewer interactions to debug than a deploy with 60. When something breaks, you know which two things to look at.
Faster feedback loops. A bug shipped today is investigated by the author today. A bug shipped four weeks ago is investigated by someone reading commit history.
Practiced rollback muscle. Teams that deploy daily have rolled back hundreds of times. Teams that deploy quarterly haven't rolled back since the last quarter. The procedure is rusty.
Blast radius. Daily deploys come with feature flags, canary releases, gradual rollouts. The deploy is decoupled from the release to user. A failed deploy at 0.1% canary affects 0.1% of users.
The 2023 DORA finding that crystallizes this: elite teams have a change failure rate around 5% and an MTTR under one hour. They aren't avoiding failures. They catch and recover from them in minutes instead of days. See Change Failure Rate: what's normal for the stability side.
What suppresses Deployment Frequency
Most low-tier scores aren't an engineering skill problem. They're a process problem. The usual culprits:
| Suppressor | Mechanism | Fix direction |
|---|---|---|
| Manual change-approval gates (CAB) | Each release waits days for review board | Replace with automated policy + post-deploy review |
| Slow CI (>30 min) | Engineers batch changes to avoid the wait | Parallelize tests, cache builds, target <10 min |
| Release windows ("Thursday 6pm only") | Caps theoretical maximum to 1/week | Decouple deploy from release via feature flags |
| Long-lived feature branches | Big-bang merges create monthly burst pattern | Trunk-based + small PRs |
| Fear culture ("last deploy broke prod") | Engineers avoid deploying near the weekend | Invest in rollback automation; safer deploys reduce fear |
| Coupled deployments (must ship A and B together) | Service dependencies force batched releases | Backward-compatible APIs, expand/contract migrations |
If you're asking your team to "deploy more" without removing these, you're asking them to take more risk. They will refuse, correctly. The practical sequence is in Monthly to Daily: deployment-frequency playbook.
One honest limit: "5 deploys/day" means almost nothing for a team of three. A 3-person team owning 8 services and deploying each once a day is at 24/day. That's noise from architecture choice, not elite throughput.
At PanDev Metrics, we compute Deployment Frequency automatically from CI/CD events and Git tags, broken out per service, per team, and per environment, with rollback-aware filtering so failed deploys don't inflate the number. The same pipeline feeds Lead Time, MTTR, and Change Failure Rate, because no single DORA metric should be read alone. For lead-time, see Lead Time for Changes: 4 stages. For recovery, MTTR benchmarks.
FAQ
What is Deployment Frequency?
The DORA metric measuring how often a team releases code to production successfully. Counted as deploys per time window (day/week/month), reported as median.
How many times per day do elite teams deploy?
DORA 2023 defines elite as on-demand, multiple times per day. In practice that lands between 3 and 50 production deploys per business day for product teams. Hyperscale orgs deploy thousands of services thousands of times per day, but those numbers aren't useful benchmarks for normal teams.
What's a normal Deployment Frequency?
For a typical 10-30 person engineering org with mature CI/CD: 1-5 deploys per day per service is healthy. Less than weekly signals a gate somewhere in the pipeline. More than 50/day per service often means you're counting hotfixes or noisy auto-deploys.
Do hotfixes count in Deployment Frequency?
Yes. Any successful deploy to production counts: planned, unplanned, hotfix, or feature release. If hotfixes dominate the count, that's a useful signal. Pair DF with Change Failure Rate, because high DF driven by hotfixes is a stability problem, not a throughput win.
How to calculate Deployment Frequency for a microservices architecture?
Report it per deployable service or per team, not as a single org-wide number. Org-wide deploys-per-day rewards splitting services without improving delivery. The useful question is: "for each service, what's the median deploy cadence?" Then aggregate by team to compare like with like.
Where this leaves you
If your team is in the medium or low tier, you're not failing. You're describing the friction in your release process. DF is the easiest DORA metric to measure and the hardest to move, because moving it means removing the manual gates, the slow CI, and the cultural caution that protected you the last time a deploy broke prod. Start by separating "deploy" from "release" via feature flags. Everything else follows.
The number to defend a year from now is not "100 deploys per day". It's: median daily deploys per service, with change failure rate under 15% and MTTR under one day. That's a real elite signal. Everything else is theatre.