New Developer Onboarding: How Metrics Show the Ramp-Up to Full Productivity

You've just hired a senior developer. They start Monday. When will they be fully productive?
HR says "30 days." The hiring manager says "a few weeks." The developer themselves says "give me the codebase and I'll be fine."
Reality is different. Coding activity data tells a more honest story about what new developer ramp-up actually looks like — and it's longer than most organizations plan for.
{/* truncate */}
The Uncomfortable Truth About Ramp-Up
Most companies treat onboarding as a one-week event: laptop setup, access provisioning, a few introductory meetings, and then "you're good to go." The expectation is that a competent developer should be contributing meaningful code within days. Research from the DORA State of DevOps Reports shows that onboarding effectiveness is one of the strongest predictors of long-term team performance — yet it remains one of the least measured processes.
This expectation is based on a fundamental misunderstanding. Setting up a development environment is not onboarding. Onboarding is the process of reaching full productivity — and for software developers, that process involves learning:
- The codebase architecture and patterns
- Business domain knowledge
- Team conventions and coding standards
- Deployment processes and infrastructure
- Internal tools and workflows
- Who to ask for what
None of this happens in a week.
What the Data Shows
At PanDev Metrics, we track individual developer activity over time. When a new developer joins a company using our platform, we can observe their coding activity from day one and watch the ramp-up curve unfold.
Based on patterns we've observed across our 100+ B2B companies with active B2B developers:
Week 1-2: The Setup Phase
Coding activity is minimal. New developers are:
- Setting up their development environment
- Getting access to repositories and tools
- Reading documentation (if it exists)
- Attending introductory meetings
- Making their first small commit (often a README edit or config change)
Typical coding activity: 10-20% of an established developer's daily output.
Week 3-4: The First Contributions
Activity starts picking up. New developers tackle their first real tasks, usually small, well-scoped tickets:
- Bug fixes in isolated components
- Small feature additions with clear specifications
- Test additions for existing code
They're writing code, but slowly. Every task requires learning something new about the codebase. A change that would take a veteran 30 minutes takes the new hire 3 hours — not because they're a bad developer, but because they're learning the system while working.
Typical coding activity: 30-50% of baseline.
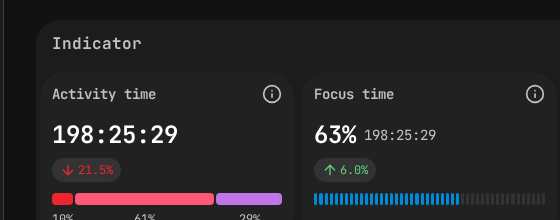
New developer metrics showing Activity Time ramp-up and Focus Time development.
Month 2: The Growth Phase
This is where acceleration happens. The developer has enough context to work independently on medium-sized tasks. They've internalized the main patterns, know where to find things, and have built relationships with team members who can help when they get stuck.
Coding hours per day increase significantly. Session lengths grow as the developer can sustain focus on longer tasks without needing to stop and look things up.
Typical coding activity: 60-80% of baseline.
Month 3-4: Approaching Full Productivity
By the third month, most developers reach 80-100% of the team's average coding activity. They're handling complex tasks, participating in architecture discussions, and reviewing others' code.
Full productivity — where the new hire's output is indistinguishable from an established team member — typically arrives around month 3 for senior developers and month 4-6 for mid-level developers in complex codebases.
The Shape of the Curve
The ramp-up curve isn't linear. It's S-shaped:
- Slow start (weeks 1-2): Minimal coding, mostly setup and learning
- Acceleration (weeks 3-8): Rapid improvement as context builds
- Plateau approach (months 3-4): Gradual convergence with team baseline
Understanding this shape helps set realistic expectations for the new hire, their manager, and leadership.
Factors That Speed Up Ramp-Up
Based on patterns across companies in our dataset, these factors correlate with faster onboarding:
1. Documentation Quality
Teams with comprehensive, up-to-date documentation (architecture docs, setup guides, coding conventions) show faster ramp-up times. This is obvious but underinvested. Every hour spent on documentation saves multiple hours across every future hire.
2. Pair Programming
Companies that pair new hires with an experienced developer for the first 2-3 weeks show measurably faster coding activity growth. The new hire learns patterns, conventions, and tribal knowledge in real-time rather than through trial and error.
3. Well-Scoped First Tasks
The best onboarding programs include a curated list of "first tasks" — small, self-contained issues that touch different parts of the codebase. Each task is a learning opportunity that builds context incrementally.
Bad first tasks: "pick any ticket from the backlog" or "add this major feature."
4. Small, Clean Codebases
This one is structural. Developers onboarding onto a clean, well-organized codebase ramp up faster than those facing a tangled legacy system. This isn't surprising, but it's worth noting: code quality affects not just maintenance but hiring velocity.
5. Automated Environment Setup
Teams where the dev environment can be set up in under an hour (using Docker, Nix, or similar) skip the multi-day setup phase entirely. This alone can save a week of onboarding time.
Factors That Slow Down Ramp-Up
1. Tribal Knowledge
If important information lives only in people's heads, every new hire needs to extract it through conversations. This is slow, unreliable, and doesn't scale. The worst version: "ask John, he built that module" — where John is in a different time zone and always in meetings.
2. Complex, Undocumented Architecture
Microservices without architecture diagrams. Shared libraries without READMEs. Config files with magic numbers. Each of these is a roadblock that slows onboarding and frustrates new hires.
3. Lack of Tests
Without test coverage, new developers can't safely experiment. They can't refactor to understand the code. They can't verify that their changes work. Fear of breaking things is the #1 productivity killer during onboarding.
4. Organizational Overhead
Long access provisioning processes, slow laptop setup, weeks of "security training" before code access — these administrative delays directly extend the ramp-up timeline. Every day a new developer can't write code is a day of lost productivity.
The Cost of Slow Onboarding
Let's do some rough math. A senior developer costs approximately $150K-$200K per year in salary, benefits, and overhead. That's roughly $750-$1,000 per working day.
If your onboarding takes 3 months to reach full productivity (the typical case), the cost curve looks like:
| Period | Lost Productivity | Cost (at $180K/year) |
|---|---|---|
| Week 1-2 | 80-90% | ~$6,000-$7,000 |
| Week 3-4 | 50-70% | ~$4,000-$5,500 |
| Month 2 | 20-40% | ~$3,500-$7,000 |
| Month 3 | 0-20% | ~$0-$3,500 |
| Total | — | $13,500-$23,000 |
That's ~$13K-$23K in reduced productivity per hire. For a company making 10 hires a year, that's ~$135K-$230K in onboarding productivity loss. Brooks's Law compounds this further — each new hire temporarily slows existing team members who spend time mentoring and answering questions.
Cutting the ramp-up by even 2 weeks saves ~$5,000-$7,000 per hire.
How to Measure Onboarding with PanDev Metrics
PanDev Metrics provides direct visibility into the onboarding ramp-up:
Track Daily Coding Hours
Compare the new hire's daily coding hours to the team average over their first 90 days. The convergence point is your real "time to productivity" — not the date they cleared HR paperwork.
Monitor Language and Project Distribution
A developer who's working across multiple repositories and languages is building broad context. One who's stuck in a single file for weeks may be blocked or struggling.
Watch for Activity Gaps
Long periods of zero coding activity during the first month often indicate environment setup issues, access problems, or a lack of clear first tasks.
Compare Across Hires
With multiple data points, you can benchmark your onboarding process. If Developer A reached baseline in 8 weeks and Developer B took 14 weeks, what was different? The data gives you a starting point for the conversation.
Recommendations for Engineering Managers
-
Set realistic expectations. Tell new hires and leadership that full productivity takes 2-4 months. This reduces pressure on the new hire and prevents leadership from wondering why the "senior developer we just hired isn't delivering yet."
-
Invest in documentation. Every architectural decision, setup step, and convention that's documented saves onboarding time for every future hire. It's the highest-leverage investment you can make.
-
Automate dev environment setup. If your setup takes more than an hour, fix it. Invest in containerized dev environments or setup scripts.
-
Assign a buddy. A dedicated onboarding buddy for the first 3-4 weeks accelerates learning significantly. Choose someone patient and knowledgeable, and give them protected time for this role.
-
Measure and iterate. Track onboarding ramp-up for every hire. Compare timelines. Identify what works and what doesn't. Treat onboarding as a process to optimize, not a one-time event.
Conclusion
Developer onboarding takes longer than most organizations acknowledge. The typical ramp-up to full productivity is 2-4 months, with a characteristic S-shaped curve. This timeline can be shortened significantly with good documentation, pair programming, and automated setup — or extended by tribal knowledge, complex systems, and organizational bureaucracy.
The first step is measuring it. You can't improve what you can't see.
Track onboarding ramp-up with real data. PanDev Metrics shows individual developer activity over time — so you can see exactly how quickly new hires reach full productivity.