Developer Utilization in Outsourcing: How to Calculate and Optimize

McKinsey's research on developer productivity found that software engineers spend only 25-30% of their working hours on active coding. The rest goes to meetings, planning, waiting, and context switching. In outsourcing, where every hour has a direct revenue implication, this split matters enormously. Your company has 40 developers. You bill clients for their time. But how much of each developer's available time is actually billable? If the answer is "I'm not sure," you have a profitability blind spot that could be costing you hundreds of thousands of dollars annually.
Developer utilization is the single most important financial metric in outsourcing. And most companies measure it wrong — or don't measure it at all.
{/* truncate */}
What Is Developer Utilization?
Developer utilization is the ratio of billable (productive) time to total available time. In outsourcing, the formula is:
Utilization Rate = (Billable Hours / Available Hours) × 100%
For example, if a developer is available 160 hours per month (standard full-time) and bills 136 hours to client projects:
Utilization Rate = (136 / 160) × 100% = 85%
This seems simple. But the devil is in how you define "billable hours" and "available hours."
What Counts as Billable Hours?
In outsourcing, billable hours are the hours you can charge to a client. This typically includes:
- Active coding on client projects
- Code reviews for client project code
- Bug fixing and debugging
- Technical documentation for the client
- Client-specific meetings (standups, planning, demos)
What Counts as Non-Billable Hours?
These are hours the developer works but you can't charge a client for:
- Bench time (waiting for a project assignment)
- Internal company meetings and training
- Interview participation (hiring other developers)
- Internal tool development
- General professional development
- Context switching between projects
- Administrative tasks (timesheets, expense reports)
What Counts as Available Hours?
Total available hours = working days × hours per day, minus:
- Paid time off (vacation, sick days)
- Public holidays
- Company-mandated training days
For a standard month: 22 working days × 8 hours = 176 hours. Minus 2 days average PTO = 160 hours. This is the denominator most outsourcing companies use.
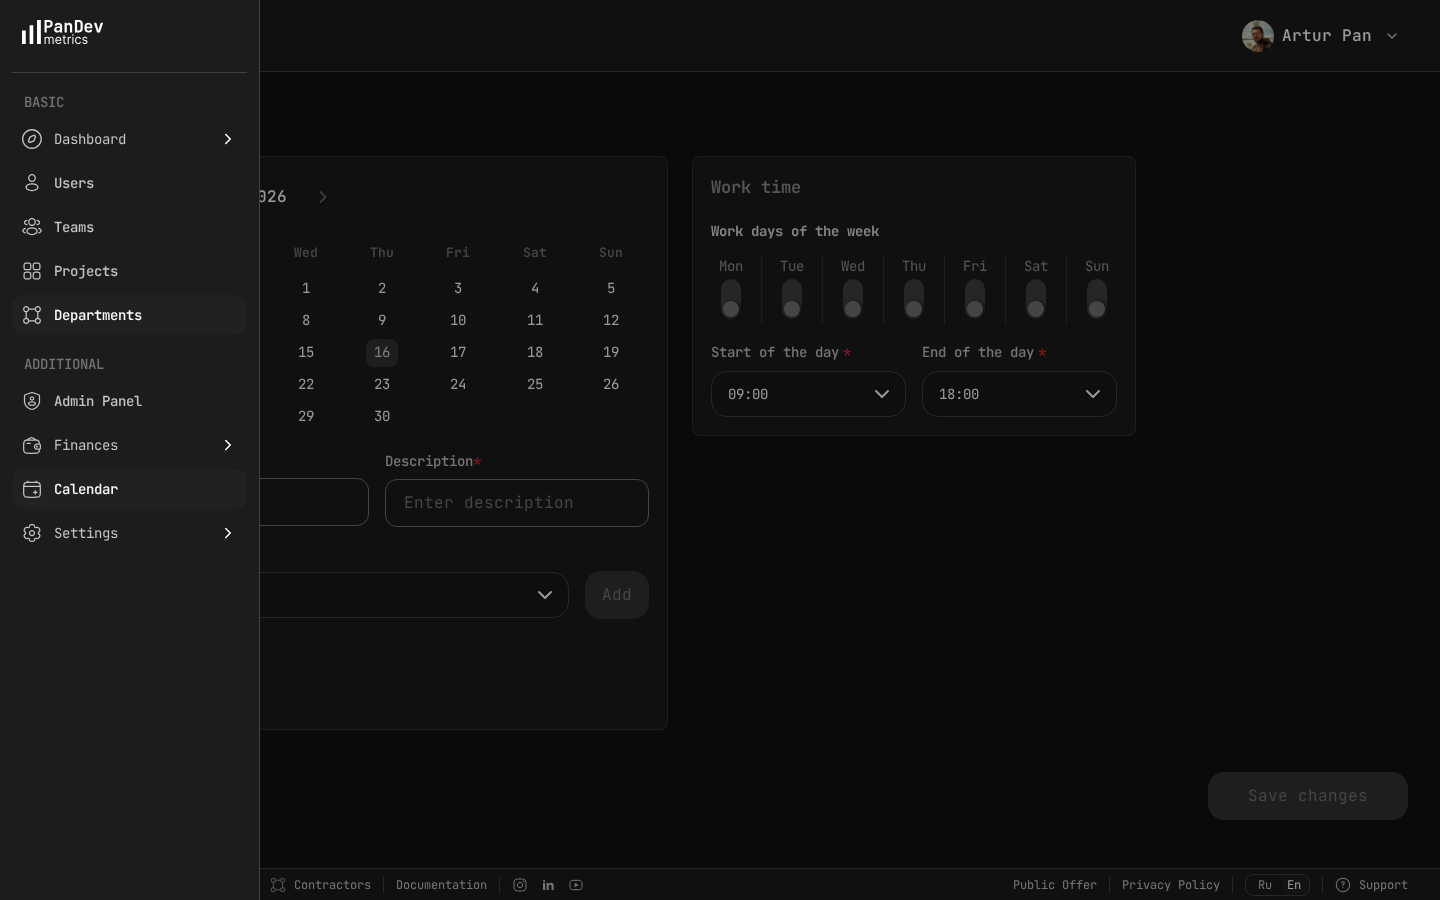 The calendar settings in PanDev define your organization's working days and hours (e.g., Mon-Fri, 09:00-18:00) — this baseline is what utilization calculations are measured against.
Why Most Companies Measure Utilization Wrong
Mistake 1: Using self-reported hours
If developers fill out timesheets, they round to 8 hours per day. Every day. This creates a false 100% utilization rate that masks the truth. Nobody bills exactly 8 hours every day — there are meetings, breaks, context switches, and interruptions.
Real utilization measured by IDE activity tracking is typically 15-25% lower than self-reported utilization. That gap is where your hidden costs live.
Mistake 2: Measuring only billable hours, not productive hours
A developer might be "billable" (assigned to a client project) but not productive (stuck in meetings, blocked by dependencies, or context-switching between tasks). True utilization has two layers:
- Billing utilization: Hours assigned to a client / Available hours
- Productive utilization: Hours of actual coding activity / Available hours
The gap between these two numbers reveals organizational inefficiency.
Mistake 3: Ignoring the bench
When a developer finishes one project and hasn't started another, they're "on the bench." Bench time is a direct cost with zero revenue. Some companies exclude bench developers from utilization calculations — which makes the numbers look better but hides the problem.
Always include bench time in your company-wide utilization calculation. If 5 out of 40 developers are on the bench, that's a 12.5% hit to company utilization that directly impacts profitability.
Mistake 4: Treating 100% as the target
A developer at 100% utilization has zero time for:
- Learning new technologies (making them more valuable long-term)
- Mentoring junior developers (reducing overall team dependency)
- Internal process improvement (making everyone more efficient)
- Buffer for unexpected urgent requests
Industry benchmarks — consistent with data from the Deloitte Global Outsourcing Survey and professional services benchmarking — suggest 75-85% utilization is the healthy range for outsourcing companies. Below 75%, you have too much idle time. Above 85%, you're likely sacrificing long-term team health for short-term billing.
How to Measure Utilization Accurately
Step 1: Track Actual Coding Activity
Replace self-reported timesheets with IDE-based activity tracking. Tools like PanDev Metrics capture actual time spent in the code editor through IDE heartbeats. This gives you:
- Objective data: No rounding, no guessing, no forgetting
- Per-project granularity: Know exactly how much time went to each client
- Daily resolution: See patterns day by day, not just monthly totals
Step 2: Categorize Time
Not all tracked time is billable. Set up your tracking system to categorize:
| Category | Example | Billable? |
|---|---|---|
| Client Project A | Coding on client A's repo | Yes |
| Client Project B | Coding on client B's repo | Yes |
| Internal Tools | Working on company tooling | No |
| Training Project | Following a course/tutorial | No |
| No Activity | No tracked IDE time | No |
PanDev Metrics categorizes automatically by project name. Client projects are mapped to client accounts, and internal projects are flagged accordingly.
Step 3: Calculate Individual and Team Utilization
Individual utilization:
Developer Alex K.
Available hours: 160 (March 2026)
Client project hours (tracked): 134.5
Internal hours (tracked): 12.0
Untracked hours: 13.5

Billing utilization: 134.5 / 160 = 84.1%
Productive utilization: (134.5 + 12.0) / 160 = 91.6%
Team utilization (10-person team):
Total available hours: 1,600
Total client project hours: 1,180
Total internal hours: 95
Total untracked: 325

Team billing utilization: 1,180 / 1,600 = 73.8%
The team is at 73.8% billing utilization — slightly below the healthy range. Time to investigate what's eating those 325 untracked hours.
Step 4: Calculate the Financial Impact
Here's where utilization becomes a profitability story.
Assumptions:
- 40 developers
- Average billing rate: $60/hour
- Average developer cost (salary + overhead): $35/hour
- Available hours per developer per month: 160
| Scenario | Billing Utilization | Billable Hours/Month | Revenue | Cost | Profit |
|---|---|---|---|---|---|
| Current state | 75% | 4,800 | $288,000 | $224,000 | $64,000 |
| +5% improvement | 80% | 5,120 | $307,200 | $224,000 | $83,200 |
| +10% improvement | 85% | 5,440 | $326,400 | $224,000 | $102,400 |
A 5% improvement in utilization generates an additional $19,200/month or $230,400/year in profit. With the same team. No new hires. No rate increases.
This is why utilization is the most important metric in outsourcing finance.
What Drives Low Utilization (and How to Fix It)
Driver 1: Bench Time
Symptom: Developers with zero or near-zero billable hours.
Root causes:
- Project ended, no new project lined up
- Mismatch between developer skills and available projects
- Slow sales pipeline
Fixes:
- Start sales conversations 4-6 weeks before a project ends
- Cross-train developers in high-demand technologies
- Use bench time productively — internal tools, open-source contributions, training
- Track bench duration and set targets (e.g., no developer on bench for more than 2 weeks)
Driver 2: Over-Meeting
Symptom: Developers with high available hours but low IDE time. The gap is filled with meetings.
Root causes:
- Client requires too many meetings
- Internal process overhead (multiple standups, retrospectives, planning sessions)
- Developer included in meetings they don't need to attend
Fixes:
- Audit meeting load per developer — compare meeting hours to coding hours
- Set a team policy: no more than 2 hours of meetings per developer per day
- Negotiate with clients to consolidate meetings
- Remove developers from meetings where they're observers, not participants
Driver 3: Context Switching
Symptom: Developer assigned to multiple projects shows lower total productive hours than developers on single projects.
Root causes:
- Developer splitting time across 2-3 client projects
- Frequent interruptions from different project stakeholders
- Lack of dedicated focus blocks
Fixes:
- Minimize project splits — dedicate developers to single projects when possible
- When splitting is necessary, use full-day blocks (not half-days or hourly switches)
- Track the utilization difference between split and dedicated developers to quantify the cost
Driver 4: Poor Onboarding
Symptom: New developers show very low utilization in their first 2-4 weeks on a project.
Root causes:
- Inadequate project documentation
- No buddy/mentor assigned
- Complex local development setup
- Unclear first tasks
Fixes:
- Create standardized onboarding checklists per project
- Track time-to-productivity: how many days until a new developer's utilization matches the team average?
- Assign a technical buddy for the first two weeks
Driver 5: Technical Blockers
Symptom: Developer activity drops mid-week, then recovers — suggesting they were blocked and had to wait for resolution.
Root causes:
- Waiting for code reviews
- Blocked by environment/infrastructure issues
- Dependency on another team's deliverable
Fixes:
- Monitor daily activity patterns — a sudden drop in a developer's tracked hours is a signal
- Implement SLA for code reviews (e.g., all PRs reviewed within 4 hours)
- Reduce environment dependencies with containerization and infrastructure-as-code
Utilization Benchmarks for Outsourcing
Based on industry data and our observations across outsourcing companies:
| Utilization Range | Assessment | Typical Causes |
|---|---|---|
| Below 65% | Critical — profitability at risk | High bench time, many internal projects, process overhead |
| 65% – 74% | Below target — room for improvement | Some bench time, meeting overload, onboarding gaps |
| 75% – 84% | Healthy — target range | Well-managed allocation with room for non-billable work |
| 85% – 90% | High — watch for burnout | Efficient but potentially unsustainable |
| Above 90% | Danger zone — unsustainable | No time for learning, no buffer for unexpected work |
Your target depends on your business model. Staff augmentation companies can aim for the higher end (80-85%) because developers are dedicated to one client. Project-based outsourcing typically lands in the 70-80% range because of project transitions and internal coordination.
Building a Utilization Dashboard
Your utilization dashboard should show:
Company-Level View
- Overall billing utilization rate (current month and trend)
- Number of developers on bench
- Revenue at risk from under-utilization (calculated in dollars)
- Distribution: how many developers are in each utilization bracket
Team/Project Level View
- Per-project utilization rates
- Allocation efficiency: planned vs. actual hours per project
- Budget burn rate: are projects consuming resources as planned?
Individual Level View
- Per-developer utilization rate
- Billable vs. non-billable hours breakdown
- Activity pattern (daily hours chart)
- Project allocation (what percentage of time goes where)
PanDev Metrics provides these views out of the box — with per-employee dashboards showing activity time, project breakdown, and cost data based on configured hourly rates.
The Utilization Review Cadence
Weekly (PM Level)
- Check individual utilization for developers you manage
- Identify anyone below 60% and investigate
- Flag bench developers and escalate to sales/management
Monthly (Management Level)
- Review company-wide utilization rate
- Calculate the financial impact of current utilization vs. target
- Identify systemic issues (meeting overload, slow onboarding, bench backlog)
- Set improvement targets for next month
Quarterly (Executive Level)
- Utilization trend over the quarter
- Correlation between utilization and revenue
- Utilization by client/project type — which engagements are most efficient?
- Strategic decisions: hiring, training investments, service portfolio adjustments
Key Takeaways
- Developer utilization is the ratio of billable hours to available hours — and it directly drives outsourcing profitability
- Self-reported timesheets create a false picture; IDE-based tracking reveals the truth
- The healthy utilization target for outsourcing is 75-85% — not 100%
- A 5% improvement in utilization can generate over $200,000 in annual profit for a 40-developer company
- The top utilization killers are bench time, over-meeting, context switching, poor onboarding, and technical blockers
- Each killer has specific, measurable fixes — but you need data to diagnose them
- Build a utilization dashboard at company, team, and individual levels with weekly, monthly, and quarterly review cadences
Measure what matters. PanDev Metrics tracks real developer activity across all your projects, calculates costs with configurable hourly rates, and gives you the utilization visibility you need to maximize outsourcing profitability.