Digital Agency: Utilization and Multi-Project Metrics

Digital agency CEOs live and die by utilization rates. According to SoDA (Society of Digital Agencies) benchmarks, the target billable utilization for development teams is ~75-85% — and most agencies fall short. Every hour a developer spends on non-billable work is lost revenue. Every project that goes over budget eats into margins. And with 5, 10, or 20 client projects running simultaneously, knowing where everyone's time actually goes is nearly impossible.
Most agencies rely on manual time tracking. Developers fill in timesheets at the end of the week, guessing how many hours went to each project. The data is inaccurate, the process is hated, and the resulting numbers drive decisions worth hundreds of thousands of dollars.
There's a better way.
{/* truncate */}
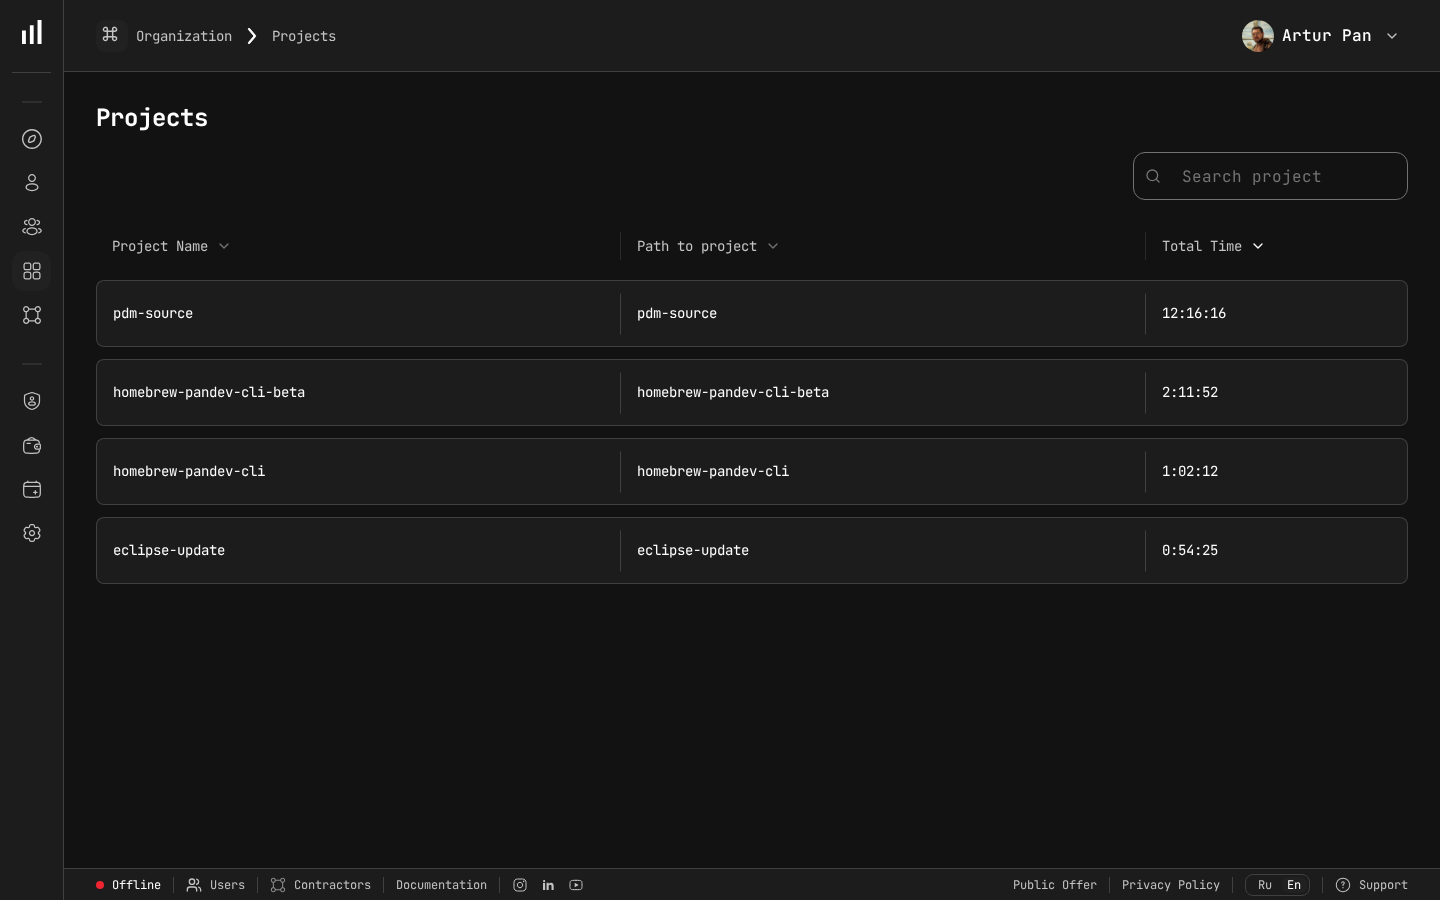
Multi-project time tracking — essential for agency utilization calculations.
The Agency Metrics Problem
Digital agencies face a unique combination of challenges that other software companies don't:
Multiple Simultaneous Projects
A SaaS company has one product. An agency might have 15 active projects across different clients, technologies, and team compositions. Each project needs its own metrics, but you also need an agency-wide view.
Billable vs. Non-Billable Work
The fundamental agency metric is utilization: what percentage of available engineering time is billable? But calculating this accurately requires knowing what developers are actually working on — not what they say they're working on.
Fixed-Price vs. Time-and-Materials
Fixed-price projects need tight scope management and early warning when hours are exceeding estimates. Time-and-materials projects need accurate tracking to justify invoices and maintain client trust.
Context-Switching Tax
Developers working across multiple projects pay a context-switching tax that's real but invisible. A developer on three projects doesn't deliver 33% to each — they might deliver 25% to each (or less), with the remaining time lost to context-switching.
Client Reporting
Clients want to see what they're paying for. Agencies need to produce reports that demonstrate progress and justify costs — ideally without spending hours preparing them.
Engineering Metrics for Agency Profitability
Utilization Rate: The Metric That Pays the Bills
Utilization rate = billable hours / available hours. Simple in theory, but accurate measurement requires knowing what developers are actually doing.
Manual time tracking problems:
- Developers estimate time entries at week's end (inaccurate)
- Context-switching between projects makes allocation guessing harder
- Small tasks (quick bug fix for Client A while working on Client B) go untracked
- Internal projects, learning time, and meetings get underreported
IDE heartbeat tracking solves this. PanDev Metrics captures activity automatically, tied to the repository or project the developer is working on. If your developer switches from Client A's repo to Client B's repo, the system records it. No timesheets, no guessing.
This gives you an accurate picture of:
- How many hours each developer is actually coding per day (Activity Time)
- How that time splits across projects
- How much time goes to non-project work (internal tools, learning, meetings, etc.)
Project-Level Metrics
For each client project, track:
Deployment Frequency: How often is the team shipping to the client's environments? High deployment frequency indicates healthy project momentum. Sudden drops signal blockers.
Lead Time for Changes: How long does it take from code to delivery? In agency work, this often includes client review and approval stages that can dominate the timeline.
Change Failure Rate: Are deployments causing issues? A high rate means you're spending billable hours on rework, which destroys margins on fixed-price projects.
Activity Distribution: What's the split between feature development, bug fixes, and maintenance? If a project that's supposed to be in "active development" is spending 50% of time on bug fixes, the original code quality was poor and the project economics are deteriorating.
PanDev Metrics tracks all of these across your Git platforms (GitLab, GitHub, Bitbucket, Azure DevOps) and project tracking tools (Jira, ClickUp).
Financial Analytics: Understanding True Project Profitability
Revenue per project is easy to calculate. True profitability requires understanding the actual engineering cost, which requires accurate time allocation.
PanDev Metrics' financial analytics connect engineering activity to project costs:
- Actual hours per project based on IDE activity data, not timesheets
- Cost per project based on team member rates and actual time allocation
- Margin analysis comparing actual engineering cost to project revenue
- Trend analysis showing whether project profitability is improving or declining
This data often reveals uncomfortable truths:
- The "profitable" project is actually underwater because developers spend more time on it than the estimates assumed
- The "small client" project is actually your highest-margin engagement
- Internal projects consume more engineering time than anyone realized
Multi-Project Developer Efficiency
Developers working on multiple projects simultaneously are less efficient per-project than dedicated developers. But the economic reality of agency work often requires multi-project allocation.
Track the impact:
Focus Time per project: PanDev Metrics shows uninterrupted coding blocks per project. If a developer working on three projects never gets more than 30 minutes of Focus Time on any single project, they're spending most of their time regaining context.
Context-switching frequency: How often do developers switch between project repositories? More than 3-4 switches per day indicates excessive multi-tasking.
Optimal project load: Track developer efficiency (Focus Time / Activity Time) against number of simultaneous projects. Most agencies find that 2 projects is manageable, 3 projects reduces efficiency significantly, and 4+ projects is counterproductive.
Use this data to make allocation decisions: sometimes dedicating a developer full-time to one project for two weeks is more productive than splitting them across three projects for four weeks.
Building the Agency Dashboard
CEO/Management View
Overall Utilization:
- Agency-wide utilization rate (SoDA benchmarks suggest ~75-85% as optimal for developers)
- Utilization by team/department
- Utilization trend (weekly/monthly)
Project Portfolio:
- Active projects with status indicators (on track, at risk, over budget)
- Revenue vs. actual engineering cost per project
- Projects ranked by profitability
Capacity:
- Available developer hours vs. committed hours
- Upcoming capacity gaps or surplus
- Pipeline projects and required capacity
Project Manager View
Per-Project Metrics:
- Deployment frequency and lead time
- Activity Time allocated to the project
- Change failure rate
- Progress against milestones (integrated with Jira/ClickUp)
Team Allocation:
- Which developers are assigned and their actual activity on the project
- Focus Time per developer on this project
- Potential context-switching issues
Developer View
Personal Metrics:
- Activity distribution across projects
- Focus Time trends
- Deployment and commit activity
Developers should see their own data — it helps them understand their own patterns and advocate for better project allocation.
Client Reporting: Automated Transparency
Agency clients want to know what they're paying for. Engineering metrics automate this reporting:
For Time-and-Materials Clients
Automated reports showing:
- Development activity hours attributed to their project
- Deployments delivered
- Features completed (from Jira/ClickUp integration)
- Quality metrics (change failure rate, bug counts)
This is far more credible than a spreadsheet of logged hours. Clients can see that work is actually happening, correlated with tangible deliverables.
For Fixed-Price Clients
Progress-oriented reports:
- Milestone completion status
- Deployment frequency showing consistent delivery
- Remaining work estimate based on current velocity
- Quality metrics demonstrating professional delivery
For Retainer Clients
Activity and value reports:
- Hours of development activity during the retainer period
- Changes deployed
- Issues resolved
- Improvements delivered
These reports take minutes to generate from PanDev Metrics dashboards instead of hours of manual compilation.
Optimizing Agency Operations
Improving Utilization Without Burning Out Developers
The temptation is to push utilization as high as possible. But engineering metrics reveal the diminishing returns:
- At ~70-75% utilization: Developers have time for learning, internal tools, and non-project work that keeps them effective. SoDA benchmarks confirm this as the sustainable floor for quality agencies.
- At ~80-85% utilization: Efficiency starts to decline. Developers rush through tasks, skip documentation, and accumulate technical debt. This is the ceiling that top agencies treat as a hard limit.
- At 90%+ utilization: Quality drops significantly. Change failure rates increase. Developers burn out and leave. The cost of replacing them far exceeds the revenue from those extra billable hours.
Track the relationship between utilization and quality metrics (change failure rate, bug counts) to find your agency's optimal utilization rate.
Right-Sizing Project Teams
Engineering metrics help you decide team composition:
- If a project's deployment frequency is declining despite full allocation, the team might be too large (coordination overhead) or too small (blocked on dependencies)
- If lead time is long but Activity Time is low, the bottleneck is outside the development team (client approvals, design handoffs, infrastructure)
- If Focus Time is low across the project team, there are too many meetings or too much context-switching
Pricing Future Projects More Accurately
Historical engineering metrics make estimation dramatically better:
- Average cost per feature type based on actual data from similar past projects
- Typical change failure rate for similar technology stacks (budget for rework accordingly)
- Context-switching overhead when developers will be shared across projects
Instead of guessing "this project will take 400 hours," you can say "similar projects averaged 450 hours of developer Activity Time, with 15% spent on bug fixes and 10% on deployment and infrastructure."
Identifying Unprofitable Patterns
Metrics reveal patterns that erode profitability:
- Scope creep: Activity distribution shifting from planned features to unplanned work
- Maintenance traps: Projects where bug fixes consume more time than new development
- Client bottlenecks: Long lead times caused by slow client feedback, not slow development
- Technology mismatches: Higher change failure rates and longer lead times on unfamiliar technology stacks
Implementation for Agencies
Phase 1: Connect and Measure (Week 1-2)
- Deploy PanDev Metrics and connect your Git platforms
- Install IDE plugins across your development team (10+ IDEs supported)
- Connect project tracking (Jira, ClickUp) to correlate activity with projects
- Start collecting data — no changes to process yet
Phase 2: Baseline and Insights (Week 3-4)
- Review utilization data — how does actual utilization compare to what you thought?
- Analyze project profitability — are your assumptions about profitable vs. unprofitable projects correct?
- Examine Focus Time — how much context-switching is happening?
- Share findings with project managers
Phase 3: Optimize (Month 2+)
- Adjust project allocations based on Focus Time and context-switching data
- Set up automated client reports
- Use financial analytics for project profitability monitoring
- Establish utilization targets with quality guardrails
Phase 4: Scale (Ongoing)
- Use historical metrics for project estimation
- Build pricing models based on actual cost data
- Monitor team health alongside utilization
- Continuously refine allocation strategies
Multi-Tenancy for Client Isolation
Agencies often need to ensure that client data is isolated — Client A shouldn't see metrics or activity related to Client B's project. PanDev Metrics' multi-tenancy support provides this isolation, ensuring that:
- Client-facing dashboards show only that client's project data
- Internal dashboards aggregate across all projects
- Access controls prevent unauthorized cross-client data access
The Bottom Line
For digital agencies, engineering metrics aren't an overhead — they're a profit optimization tool. Accurate utilization tracking, project profitability analysis, and data-driven allocation decisions can improve margins significantly while also improving developer satisfaction (less context-switching, better project assignments) and client satisfaction (transparent reporting, consistent delivery).
The agencies that measure their engineering operations outperform those that guess.
Running a digital agency? PanDev Metrics — engineering intelligence for multi-project teams, with financial analytics, automated client reporting, and real utilization tracking.