Diversity Metrics in Engineering: Beyond Hiring Numbers

A public company we'll call Company X hit its 2023 engineering DEI target: 28% women in engineering, up from 21%. Two years later, the number was back to 22%. Hiring kept working; retention didn't. The post-mortem found three patterns the original program missed: under-promotion of women with 2-4 years tenure, above-average code-review rejection rates for under-represented minorities, and assignment bias toward "glue work" that doesn't count for promotion.
Most engineering DEI programs stop measuring at the top of the funnel. Hiring numbers are public, easy to collect, and lend themselves to targets. What happens after someone joins — the promotion rate, the review cycle, the assignment pattern — is where culture actually lives. And it's where programs succeed or fail quietly, often without management noticing until the exit interviews pile up.
{/* truncate */}
The problem: the DEI iceberg
The visible tenth is hiring. The hidden ninety is everything downstream:
- Onboarding experience
- First-year retention
- Code review patterns
- Assignment distribution (feature work vs glue work vs on-call)
- Promotion velocity
- Exit timing and stated reasons
- Representation at levels 5+
Harvard Business Review's 2023 research (Ellen Kossek, Rebecca Thompson) found that 76% of corporate DEI programs track only hiring and representation, while fewer than 20% track promotion velocity by demographic — the metric that actually predicts 5-year representation. You cannot improve what you don't measure; this is the gap that turns DEI into a reporting exercise.
Github's 2024 Octoverse report added a specific data point: code review rejection rates for contributors from under-represented backgrounds run 8-15% higher than the baseline in open-source projects. The effect replicates in internal enterprise data sets when teams run the analysis — most teams don't.
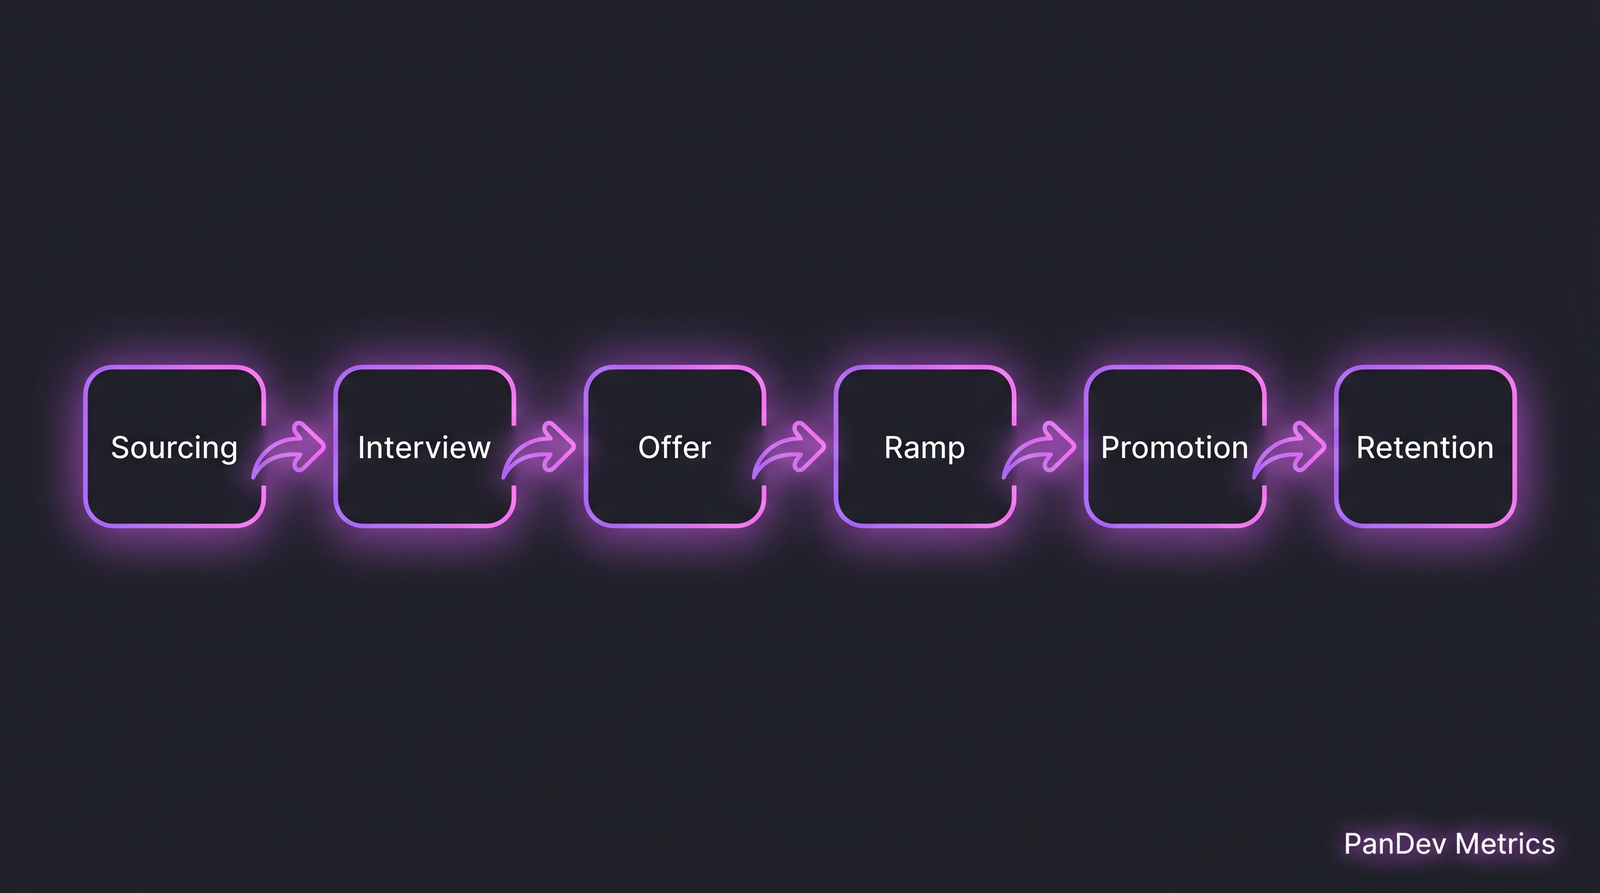 Six stages, each a filter. Hiring numbers measure the first three. Culture lives in the last three.
The 8 metrics that actually tell the story
Ordered by how much they predict real inclusion:
1. First-year retention by demographic group
What it is: Percentage of new hires still with the company 12 months later, disaggregated.
Why it matters: Hire 30% women, retain 18% of them to year one, and you're running a high-churn factory. The funnel is wider at the top but leakier than the baseline.
Benchmark: industry-wide first-year attrition is ~20%. Gap of >5 percentage points between groups is a warning sign.
2. Promotion velocity (time at level) by demographic
What it is: Median time between promotions, disaggregated.
Why it matters: The "broken rung" effect. McKinsey's Women in the Workplace 2024 report found women are promoted from L3 to L4 at 0.82× the rate of men in tech — and that single delta compounds to the representation gap at L6+.
Benchmark: gaps >15% are actionable; gaps >30% are an urgent signal.
3. Code review acceptance rate by author demographic
What it is: Fraction of PRs accepted on first review, disaggregated.
Why it matters: Captures unconscious-bias effects in the daily review loop. Requires careful anonymization to measure ethically — don't build a dashboard with names attached.
Benchmark: <5% variance is normal; >10% is an actionable gap that often points to specific reviewers.
4. Assignment share: feature work vs glue work
What it is: Distribution of "glue work" (coordination, docs, tests, mentoring, incident triage) vs feature work, by person.
Why it matters: Tanya Reilly's 2024 The Staff Engineer's Path research shows women and minorities take on 1.4-2.0× more glue work. Glue work doesn't get credited in promotions, so it compounds the promotion-velocity gap.
Benchmark: distribution should be roughly proportional to team size; large deltas indicate bias.
5. Interview panel diversity vs offer panel rating gap
What it is: Compare offer-yes rating across interviewers. Does a panel with one under-represented interviewer rate candidates differently?
Why it matters: Diverse interview panels are cited as a best practice; measuring whether they actually change outcomes on your team is the real test.
6. Entry-level pay band compression
What it is: Salary variance within the same level, by demographic.
Why it matters: Under-representation often starts at offer negotiation. A hire who accepted the first offer starts at the band floor; one who negotiated starts higher. Over 3 years this compounds.
Benchmark: <3% variance within level is healthy; >8% suggests negotiation-outcome bias.
7. Sponsorship and project visibility
What it is: Track who is staffed on high-visibility projects over a rolling 12 months.
Why it matters: Sponsorship, not mentorship, drives promotion. Ensuring under-represented engineers are on the executive-visible projects at proportional rates is one of the few things that directly moves the promotion gap.
8. Exit reasons and tenure distribution
What it is: Why people leave, and after how long. Disaggregated.
Why it matters: Exit interviews are lagging indicators but still useful. If under-represented folks are leaving at year 2 citing "growth opportunities," you have a mid-funnel problem.
Collecting the data without creating harm
DEI measurement has ethics attached. Four rules:
| Rule | Why |
|---|---|
| Voluntary self-identification | Forced disclosure damages trust |
| Aggregate reporting only (n >= 5) | Avoids re-identification |
| Disaggregate by multiple axes cautiously | Intersectionality creates small cells; guard against re-identification |
| Separate data from decision-making | The analyst running the data shouldn't be the promotion decision-maker |
This is where an enterprise-grade tenancy model helps — data access controls at the department level, audit logs on who accessed what, and tenant-timezone correctness so global teams report cleanly. Our on-premise deployment pattern is often chosen precisely because HR-adjacent data can't leave the company boundary for compliance reasons.
The template program: what a working DEI dashboard looks like
A minimal monthly report, measurable in any modern engineering-metrics stack:
| Section | Metrics |
|---|---|
| Funnel | Applications by source, interview-pass rate, offer rate, accept rate (by demographic) |
| Onboarding | Time-to-first-PR, time-to-first-ship, 30/60/90 day retention |
| Review cycle | PR cycle time, first-review acceptance rate, median reviewer count |
| Assignment | Feature vs glue work share, on-call rotation fairness |
| Growth | Promotion velocity, cross-team project staffing |
| Attrition | 12-month, 24-month retention; exit category distribution |
Run the report quarterly, disaggregate where n ≥ 5, share with leadership monthly. Share aggregate trends with the team quarterly. Do not share individual data.
Common mistakes
- Hiring-only reporting. The loudest metric is the least predictive of culture.
- Single-axis disaggregation. "Women in engineering" without breaking down by role, level, tenure hides the real story.
- Public individual data. Building an internal dashboard with names creates career risk for under-represented engineers and legal risk for the company.
- "Diversity is a hiring problem." Hiring can move the funnel top by 30%; retention and promotion move the funnel bottom by 100%. The math is not close.
- Quotas without process changes. Hitting a target once doesn't fix the machine that created the gap. Year 2 attrition will eat the gain.
How PanDev Metrics fits here, carefully
PanDev Metrics does not ship demographic fields by default — HR data lives in your HRIS, not our platform. Where we help is with the engineering-side metrics that feed DEI analysis once HR data is joined:
Assignment fairness signal. Through project and worklog distribution, we see who is doing feature work vs review vs coordination time. Combined with HR data (on your side), you can compute metric 4 (assignment share) without asking people to self-report.
Promotion-velocity inputs. Tenure, output metrics, project-visibility signals — combined with your HR promotion data, feeds metric 2. Our data is the engineering side; HR is the promotion event.
Code-review acceptance rates (anonymized). Aggregate PR acceptance and reviewer distribution can surface metric 3 when crossed with HR demographic data at aggregate levels (n ≥ 5).
The deliberate choice: we don't own the sensitive data. We provide the engineering-side signal that makes the sensitive data actionable. This is consistent with our metrics-without-toxicity stance — the same data, used well or badly, produces very different cultures. Cross-reference with our 10 metrics every EM should track for the baseline set.
Contrarian claim: you can measure bias without a dashboard
Teams get fixated on building a DEI dashboard before they've run a single one-off analysis. Run these three analyses once, manually, on your current data:
- Pull 12 months of PR data. Compute first-review acceptance rate by author, anonymized. Look at the distribution tails.
- Pull 12 months of promotion data. Compute median tenure-at-level by demographic. Look at the gap.
- Pull the last 20 "hero" incident responses. Count who was tagged. Look at over-representation.
If those three analyses don't surface anything — you probably don't have a measurable gap today. If they do, you have the story you need to justify the full program. The dashboard is optional; the first analysis is not.
The honest limit
Our platform doesn't provide demographic analytics itself; the cross-cuts above assume your HRIS data is joined externally or stays on your side. The effect-size numbers we cite (Octoverse 8-15%, McKinsey 0.82×) are from the cited public research, not our telemetry. We don't have the cross-identity data to validate those claims on our own customer base, and we won't invent numbers where we don't have signal.
DEI is also culture-specific. A program that works in a 200-person US tech company may not fit a 40-person Kazakh fintech with different demographic categories and different legal frameworks. Localize before copy-pasting frameworks.
The sharpest claim
A DEI program measured only by hiring is a year-one program. Most companies run year-one programs forever. The teams that actually change representation at senior levels are the ones who moved past hiring metrics into retention, promotion, and assignment — with the same rigor they apply to DORA. Engineering leaders who can read a DORA report but can't read a promotion-velocity report are leading only half of their org.
Related reading
- Engineering Metrics Without Toxicity — how to measure without creating surveillance culture
- 10 Engineering Metrics Every Manager Should Track — the baseline metric set
- On-Premise Docker/K8s Deployment — for regulated HR data
- External: McKinsey: Women in the Workplace 2024 — the "broken rung" data
- External: GitHub Octoverse 2024 — open-source review patterns