DORA Metrics in 2026: Complete Guide with Benchmarks & Examples

According to the 2023 McKinsey developer productivity report, developers spend only 25-30% of their time writing code. The rest disappears into meetings, waiting, and process overhead. DORA metrics exist to make that invisible waste visible — and fixable.
If you're a CTO, VP of Engineering, or Engineering Manager who hasn't adopted DORA yet, you're managing by intuition in an era that demands evidence. This guide covers what each metric measures, how to benchmark your team, how to implement tracking, and the mistakes that make DORA data useless.
{/* truncate */}
What Are DORA Metrics?
DORA (DevOps Research and Assessment) metrics come from the research team behind Google's Accelerate: State of DevOps reports. After studying thousands of engineering organizations over 10 years, they identified four key metrics that predict software delivery performance and organizational success.
These aren't vanity metrics. The research, based on data from over 36,000 professionals across ten years of annual surveys, has demonstrated statistically significant links between DORA performance and organizational outcomes including profitability and market share. Teams that score "Elite" deliver 973x more frequently than low performers, with 6,570x faster lead times (Accelerate State of DevOps Report, 2023).
The Four DORA Metrics
1. Deployment Frequency
What it measures: How often your team deploys code to production.
| Performance level | Benchmark |
|---|---|
| Elite | On-demand (multiple times per day) |
| High | Between once per day and once per week |
| Medium | Between once per week and once per month |
| Low | Less than once per month |
Why it matters: High deployment frequency means smaller changesets, lower risk per deploy, and faster feedback loops. Teams that deploy daily catch bugs in hours, not weeks.
Common mistake: Counting "merges to main" instead of actual production deployments. A merge is not a deploy.
2. Lead Time for Changes
What it measures: Time from first commit to code running in production.
| Performance level | Benchmark |
|---|---|
| Elite | Less than one hour |
| High | Between one day and one week |
| Medium | Between one week and one month |
| Low | More than one month |
Why it matters: Long lead times mean slow feedback, large risky releases, and frustrated product teams waiting weeks for a "small fix."
The 4 Stages of Lead Time
Most tools show Lead Time as a single number. That's like a doctor saying "you're sick" without telling you what's wrong. PanDev Metrics breaks Lead Time into 4 stages:
| Stage | What happens | Where time is lost |
|---|---|---|
| Coding | First commit → Merge Request created | Developer working on the feature |
| Pickup | MR created → First review | Waiting for someone to start reviewing |
| Review | First review → MR merged | Review cycles, back-and-forth |
| Deploy | MR merged → Running in production | CI/CD pipeline, manual approvals |
This breakdown reveals where your bottleneck actually is:
- Long Coding stage? Tasks are too large — break them down.
- Long Pickup stage? Your team has a review culture problem — PRs sit unreviewed.
- Long Review stage? Too many review cycles — clarify standards upfront.
- Long Deploy stage? Your CI/CD pipeline needs work — automate approvals.
3. Change Failure Rate
What it measures: Percentage of deployments that cause a failure in production (requiring a hotfix, rollback, or patch).
| Performance level | Benchmark |
|---|---|
| Elite | 0–5% |
| High | 5–10% |
| Medium | 10–15% |
| Low | More than 15% |
Why it matters: Deploying frequently is only valuable if deploys don't break things. Change Failure Rate balances speed with stability.
Common mistake: A 0% failure rate isn't good — it usually means you're not deploying enough, or you're not detecting failures. 5% is healthy.
4. Mean Time to Restore (MTTR)
What it measures: How long it takes to recover from a failure in production.
| Performance level | Benchmark |
|---|---|
| Elite | Less than one hour |
| High | Less than one day |
| Medium | Between one day and one week |
| Low | More than one week |
Why it matters: Failures are inevitable. What separates elite teams is how fast they recover. An MTTR of 30 minutes means a production incident is a minor inconvenience. An MTTR of 3 days means it's a crisis.
How DORA Metrics Work Together
The four metrics form two pairs:
Speed pair:
- Deployment Frequency (how often)
- Lead Time (how fast)
Stability pair:
- Change Failure Rate (how safe)
- MTTR (how resilient)
Elite teams score high on both speed and stability. This is the key insight from the DORA research, first articulated in Accelerate by Forsgren, Humble, and Kim (2018): speed and stability are not trade-offs. The best teams are both fast and safe. This finding has been replicated consistently across every subsequent State of DevOps Report.
According to Forbes Kazakhstan, companies that adopted DORA-aligned engineering metrics saw "a 30% productivity increase, while release quality improved by 25%." — Forbes Kazakhstan, April 2026
If you optimize only for speed (high deploy frequency, low lead time) but ignore stability — you'll ship bugs constantly. If you optimize only for stability (low failure rate) but ignore speed — you'll deploy once a quarter and still have outages.
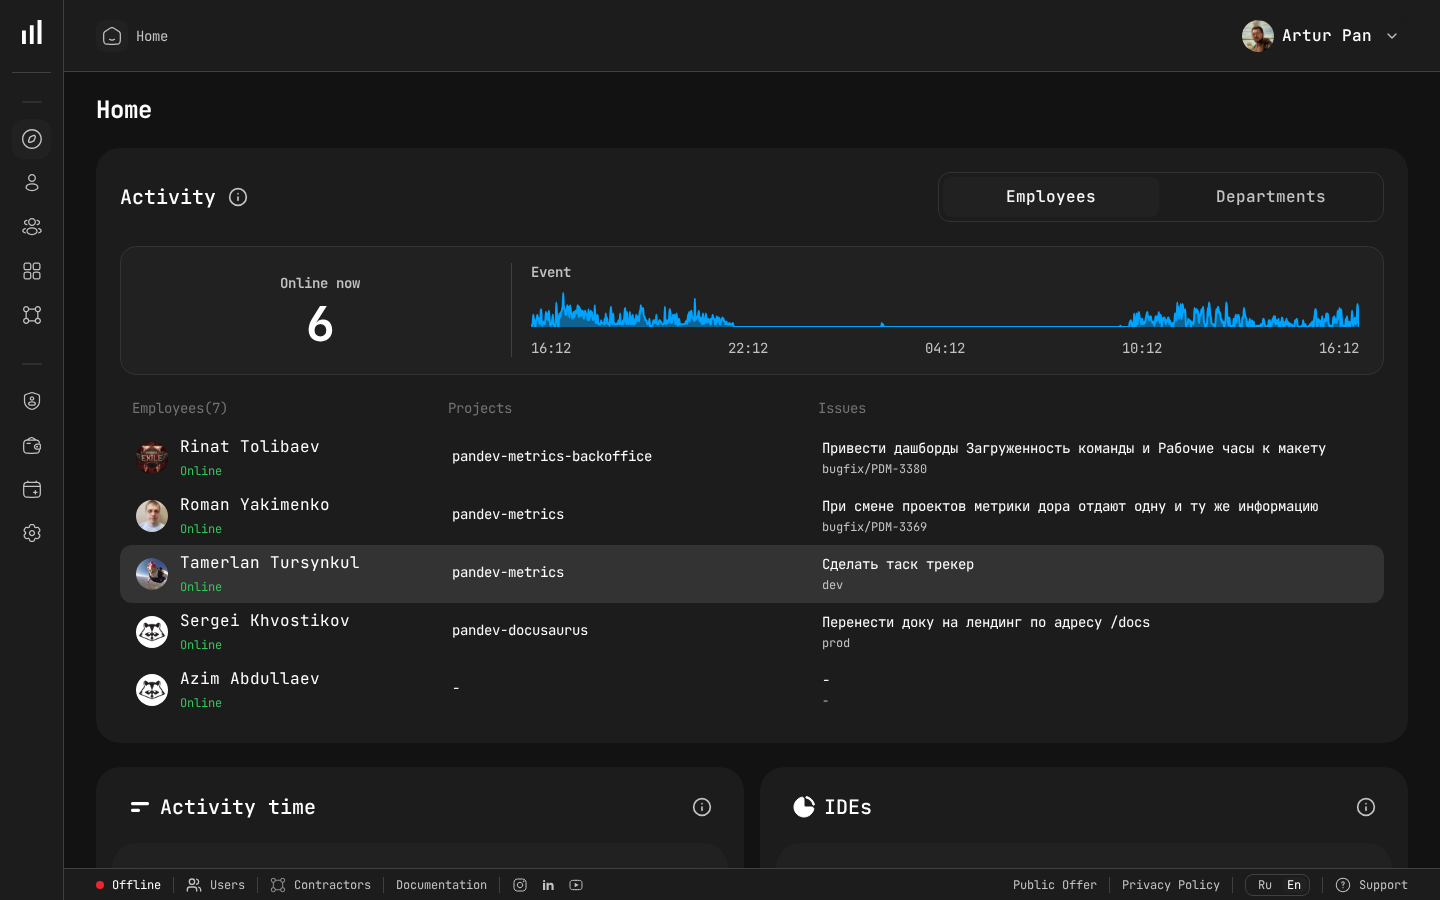 PanDev Metrics team dashboard — Activity, Online status, Event timeline, and team overview in one place.
Implementing DORA Metrics: A 2-Week Plan
Week 1: Connect Your Data Sources
| Day | Action |
|---|---|
| 1 | Connect your Git provider (GitLab, GitHub, Bitbucket, or Azure DevOps) via webhooks |
| 2 | Define your production branch(es) and deployment detection rules |
| 3 | Connect your task tracker (Jira, ClickUp) to link issues to deployments |
| 4-5 | Let data accumulate — you need at least a few deployments to see meaningful metrics |
Week 2: Establish Baselines and Identify Bottlenecks
| Day | Action |
|---|---|
| 6 | Review your first DORA dashboard — identify which performance level you're at |
| 7 | Drill into Lead Time stages — find where time is being lost |
| 8 | Set initial targets (e.g., "reduce Pickup time from 18h to 8h") |
| 9-10 | Share dashboard with the team — make metrics visible, not hidden |
Five Mistakes That Make DORA Metrics Useless
1. Using DORA for individual performance reviews
DORA metrics measure team and system performance, not individual developer performance. The moment you use them in reviews, developers will game the metrics — splitting PRs artificially to boost frequency, or avoiding risky deploys to keep failure rate low.
2. Measuring without acting
A dashboard nobody looks at is worthless. Assign an owner for each metric. Review trends weekly. Set specific improvement targets.
3. Ignoring context
A team working on a legacy monolith will have different DORA numbers than a greenfield microservices team. Compare teams to their own history, not to each other.
4. Treating Lead Time as one number
"Our Lead Time is 5 days" tells you nothing actionable. You need to know which stage takes 5 days. Is it coding? Review? Deployment? Each has a completely different fix.
5. Optimizing one metric at the expense of others
Deploying 10 times a day means nothing if your Change Failure Rate is 40%. All four metrics must improve together.
DORA in 2026: What's Changed
The original DORA framework was defined in 2014. Here's what's evolved:
- AI impact measurement — Teams now track how AI code assistants (Copilot, Cursor, Claude) affect Lead Time and Change Failure Rate. Early data suggests AI-assisted PRs have similar failure rates but shorter coding stages.
- SPACE and DevEx frameworks — DORA is increasingly used alongside the SPACE framework (Forsgren, Storey, Maddila et al., 2021) and Developer Experience metrics for a fuller picture. As the SPACE authors argue, no single metric captures developer productivity — DORA measures the pipeline, SPACE measures the people.
- Platform Engineering — Internal Developer Platforms (IDPs) are measured partly by their impact on DORA metrics.
Who Should Own DORA Metrics?
| Role | Responsibility |
|---|---|
| CTO / VP Engineering | Set organizational targets, ensure metrics are visible |
| Engineering Manager | Review weekly with team, identify improvement areas |
| DevOps / SRE | Own Deploy stage optimization, MTTR response |
| Tech Lead | Own Review stage, PR standards, code review culture |
DORA benchmarks cited from the Accelerate State of DevOps Report (Google Cloud, 2023). SPACE framework: Forsgren et al., "The SPACE of Developer Productivity" (ACM Queue, 2021). McKinsey developer productivity report (2023). Implementation recommendations based on PanDev Metrics platform capabilities and data from B2B engineering organizations.
Ready to measure your DORA metrics? PanDev Metrics tracks all four DORA metrics with a 4-stage Lead Time breakdown — connect your GitLab or GitHub in 15 minutes.