DORA × Engineering Cost: The ROI Story Tools Miss

A VP of Engineering walks into the quarterly review with a clean DORA dashboard: lead time down from 9 days to 4, deployment frequency up from 1.2 per week to 2.8, change failure rate trimmed from 18% to 11%. The CFO listens patiently, then asks the only question that matters: "What did that save us in dollars?" The room goes quiet. The DORA tool does not know. The finance tool does not know either, because it does not see deployment data. The CTO ends up arguing on principle. Two quarters later, the platform team's budget is cut to fund a sales hire.
Most engineering organizations track DORA and cost in two separate systems. Sleuth, Swarmia, LinearB show you DORA. Jellyfish (its standalone finance module) and Faros show you cost. The DORA State of DevOps reports explicitly link the four DORA metrics to organizational performance, but only at the outcomes layer, not the dollar layer. To translate "we cut lead time from 9d to 4d" into a real number the CFO defends, you need both data sources in the same query. This article walks through the four integration points, then a worked Q1 → Q2 example with a 2.73x quarterly ROI.
Why DORA-only and cost-only both fail at the boardroom
DORA-only is the more common failure. The team can prove the delivery system improved. They cannot prove the company got richer. Boards do not invest in delivery system improvements; they invest in cash flow. A lead time chart trending down is a beautiful artifact and a weak budget defense.
Cost-only fails the opposite way. Finance sees the engineering line item went up by $250K and asks what changed. Engineering says "we shipped more features." Finance asks "by how much." Without DORA, more features is not a number. Without cost, fewer days of lead time is not a number either. You need both.
The deeper problem is that the two datasets answer different questions but at the same grain. DORA is per-deploy or per-PR. Cost-per-feature is per-issue or per-project. You can join them on feature_id or project_id if both live in one system. You cannot join them at all if they live in two systems with different identity schemes, and that is the default state.
PanDev Metrics tracks all four DORA metrics (deployment_frequency, lead_time_for_changes, change_failure_rate, MTTR) alongside cost-per-feature in the same Postgres schema. Same date filter, same project filter, same department filter. Asking "for projects where lead time dropped over 30%, what was the cost-per-feature delta?" is a single SQL query with two joins. We covered the cost half in Cost-per-Feature: The SQL Formula That Actually Works. This piece is the integration.
The four integration points: DORA × cost levers
Each DORA metric maps to a cost lever. Improve the metric, the cost lever moves with it. The trick is knowing the conversion rate.
| DORA metric | What gets cheaper when it improves | Mechanism |
|---|---|---|
| Lead time for changes | Cost-per-feature | Less time in WIP × loaded hourly rate. A feature parked 9 days at 4 engineers' time costs more than the same feature shipped in 4 days. |
| Deployment frequency | Cost throughput / cost-per-deployed-feature | More features delivered per quarter against the same engineering payroll. Fixed cost denominator, growing numerator. |
| Change failure rate | Rework cost (rollbacks, fixes, hot-patches) | Each failed deploy = X engineer-hours of incident response + Y hours of fix work + Z hours of re-deploy. Multiply by loaded rate. |
| MTTR | Incident cost on the burn rate | Every minute of incident is paid headcount in war-room mode + opportunity cost of the feature work paused. |
Think of these as four separate ROI drawers on the same dresser. They open independently. They also reinforce each other: a faster pipeline usually moves all four together, which is what makes the bundle math interesting and slightly dangerous (more on that in the limit section).
Lead time → cost-per-feature
This is the cleanest mechanical link. A feature in WIP burns money. Cost-per-feature is approximately:
cost_per_feature ≈ Σ (engineer-hours on the feature × loaded_hourly_rate)
Cut the calendar time in half without adding people and the engineer-hours drop too, partly because there is less idle waiting between code review, QA, and merge, and partly because context-switching overhead falls. Forsgren, Humble, and Kim's Accelerate reports elite performers ship lead times under one day; low performers run weeks-to-months. The dollar gap is not subtle. We dissect the four stages of lead time in Lead Time: The 4 Stages and Where Time Actually Hides.
Deployment frequency → cost throughput
Throughput is a denominator game. If your engineering team costs $400K per month and you ship 8 features, that is $50K per feature on average. Push deploy frequency up and you ship 14 features for the same $400K, or $28.5K per feature. The team did not get cheaper. The company got more shipped per dollar.
This only works if the extra features are real value, not vanity deployments. Doubling deploy frequency by splitting one feature into ten micro-deploys is a metric game, not a finance win. The honest version pairs deploy frequency with feature-completion count, not deploy count alone.
Change failure rate → rework cost
Every failed deploy has a cash receipt:
- Rollback engineering time (typically 2–6 engineer-hours).
- Fix work (variable, from 4 hours to a sprint).
- Re-deploy and verification time (1–3 hours).
- Customer-impact opportunity cost (revenue lost during outage windows).
The 2024 DORA report marks 0–5% as elite, 5–10% as high, 10–15% as medium, >15% as low. The math: at $46/hour loaded rate, a team running 40 deploys a quarter at 18% failure rate burns roughly 7 failed deploys × 12 engineer-hours each × $46 = $3,860/quarter in rework alone, before counting customer impact. Drop to 11% and the same team eats $2,360, a $1,500 gap on rework, plus whatever the customer-side incidents would have cost. Read the deeper breakdown in Change Failure Rate: Why 15% Is Normal and 0% Is Suspicious.
MTTR → incident cost on the burn rate
MTTR is the most direct dollar link. Every minute of an active P1 incident is paid burn rate. A 15-engineer team at $46/hour loaded loses approximately $11.50 per engineer-minute, or $172.50 per minute when the whole team is in the war room. Reduce MTTR from 90 minutes to 35 minutes and you reclaim 55 minutes × $172.50 ≈ $9,500 per incident on team time alone, never mind the customer-side revenue impact, which often dwarfs the engineering side.
The worked example: Q1 → Q2 2026 pipeline upgrade
A 14-engineer SaaS team invested $250K in a CI/CD and review-process overhaul (4 engineers × 5 weeks of dedicated platform work, fully loaded). The DORA metrics moved. So did cost-per-feature. The integrated ROI math is what made the project survive the next budget review.
| Metric | Q1 (before) | Q2 (after) | Delta |
|---|---|---|---|
| Lead time for changes | 9 days | 4 days | −56% |
| Deployment frequency | 1.2 / week | 2.8 / week | +133% |
| Change failure rate | 18% | 11% | −7 pts |
| MTTR | 90 min | 35 min | −61% |
| Cost-per-feature (avg) | $34K | $24K | −$10K |
| Features shipped in quarter | 8 | 14 | +6 |
The financial conversion:
- Per-feature savings from lead-time compression: $10K × 14 features in Q2 = $140K saved vs. running Q1 economics.
- Throughput value from extra deploys: 14 features × ~$30K average revenue impact per shipped feature = $420K incremental revenue contribution (the company's ARR-per-feature average for this segment).
- Rework avoided from CFR drop: 40 deploys × 7 percentage points × ~$300/incident in eng + customer-side blended cost ≈ $84K avoided.
- Incident cost avoided from MTTR drop: 4 incidents × 55 min × $172.50/min ≈ $38K avoided.
Total Q2 net: $140K + $420K + $84K + $38K = $682K of value against $250K invested. That is 2.73x in one quarter. Annualized at the same run-rate, ~10–11x. The project went from "engineering wants more budget" to a board-defensible line item the CFO presented herself the next quarter.
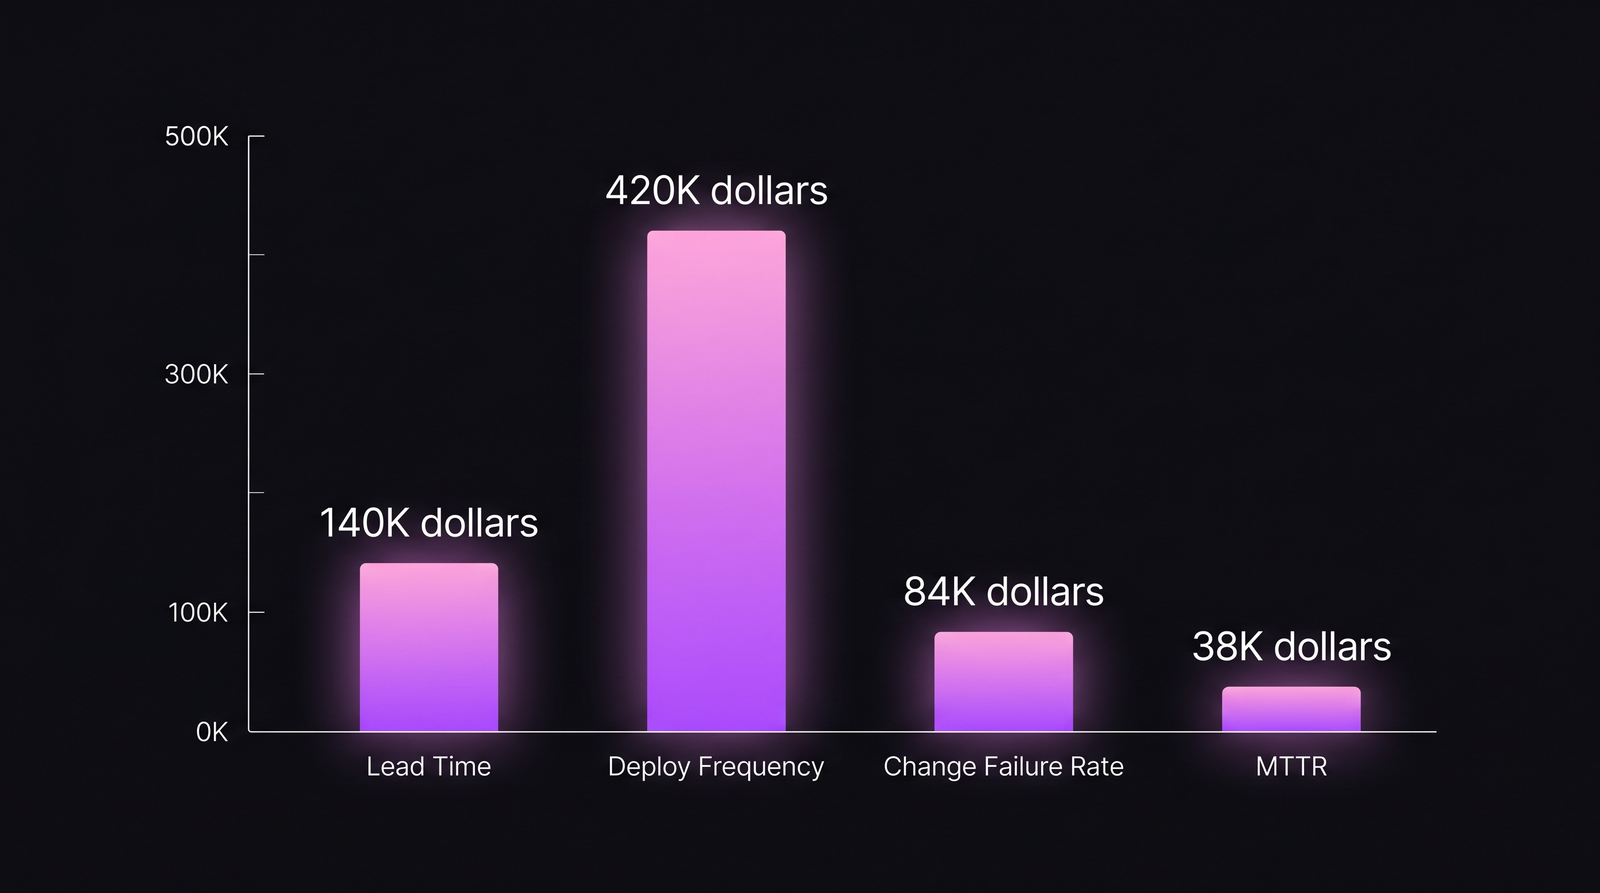
Q2 2026 dollar contribution by DORA lever. Most of the value comes from throughput, but the bundle is what makes the case.
How to actually run this analysis
Three preconditions, none of them optional:
- Single source of truth for both datasets. If DORA and cost live in two tools, you cannot do the join. Either pick one platform that has both, or build a warehouse and pay the integration tax.
- Branch-name convention with task IDs.
feature/PROJ-1180lets cost-per-feature, lead time, deploy events, and incidents all link back to the same identifier. Without it, the join is fuzzy at best. We covered cost-per-feature mechanics in Cost-per-Feature: The SQL Formula That Actually Works. - Loaded hourly rate, not nominal salary. The dollar math falls apart if you use the wrong rate. We have a separate piece on the five distinct ROI methods in Engineering ROI: 5 Methods That Survive Board Review; pick the method that matches the question being asked.
In PanDev Metrics, this is one cross-tab dashboard: DORA chart on top, cost-per-feature panel on the bottom, both filtered by the same project picker and date range. The "ROI of Q2 platform investment" question is answered with two filters, not a six-week data engineering project. That is the only reason this post exists. Most teams cannot run this analysis at all because their tools are not the same tool.
Honest limit: correlation is not causation
Here is where the math earns its skepticism tax. The pipeline upgrade reduced lead time and cost-per-feature and CFR and MTTR. So did, plausibly:
- Team morale lifting after a long stretch of friction.
- The new pipeline being easier to reason about, so PRs got smaller.
- A senior engineer joining mid-quarter and influencing review culture.
- One especially clean quarter of feature scoping by product.
PanDev's data tells you the changes happened together. It cannot tell you the precise causal share of the pipeline upgrade vs. the other variables. Treat the 2.73x as the ROI of the bundle that quarter, not the precise contribution of the platform investment alone. If you want isolated attribution, you need a hold-out team or a pre-registered experiment, and most engineering orgs cannot afford that level of rigor.
The honest CFO conversation is: "We invested $250K in the platform upgrade. The quarter that included it shipped $682K of measurable value above the prior quarter's run rate. The platform was the largest deliberate change we made. We are running the same investment again next quarter to see if the effect repeats." That framing survives audit. "Our pipeline upgrade saved $682K" does not.
What changes in your next budget meeting
Three concrete moves, in order of impact:
- Stop arguing for DORA improvements on principle. Bring the dollar number. If you cannot produce one because your tools are split, fix that first. A missing integration is a missing budget.
- Annualize cautiously. A 2.73x quarter is not a 10x year. Effects often plateau as the easy wins get harvested. Defend the next quarter, not three years.
- Pre-register the next bet. Before the platform-team budget arrives, write down what DORA deltas you expect, what dollar value they would unlock, and what would count as failure. That document is what turns engineering investment from a vibe into a hypothesis test.
DORA without cost is a delivery report. Cost without DORA is a payroll review. The integration is a budget defense. Most CTOs are still arguing on principle because their tools force them to. The ones who stop will find the boardroom math gets a lot quieter.