E-Commerce: How to Accelerate Feature Delivery Before High Season

In e-commerce, the calendar is your most demanding stakeholder. Black Friday, Cyber Monday, holiday seasons, summer sales — these dates don't move. If your new checkout flow, recommendation engine, or payment integration isn't ready by the freeze date, it waits until next year. According to the Salesforce Holiday Shopping Report, online sales during the 2024 Cyber Week exceeded $300 billion globally — a single percentage point of downtime translates to billions in lost revenue across the industry.
Engineering metrics give you the visibility to spot delivery risks months in advance, not days before the deadline.
{/* truncate */}
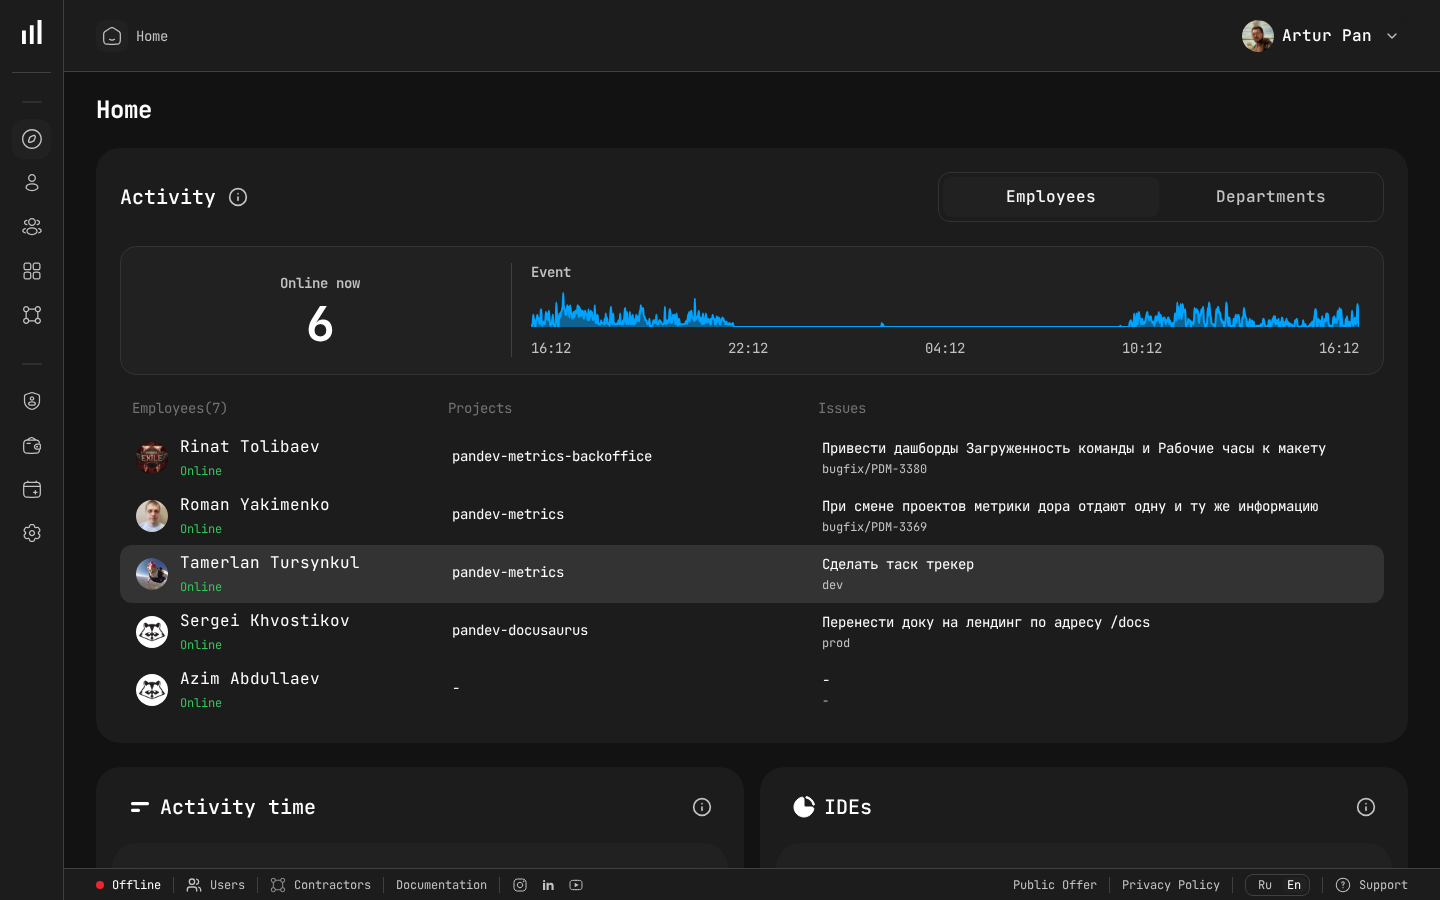
Real-time team visibility during high-season feature sprints.
The E-Commerce Engineering Calendar
E-commerce engineering teams operate on a rhythm that most other industries don't experience. The year looks something like this:
- January–March: Post-mortem from last season, architecture improvements, technical debt reduction
- April–June: Major feature development for the upcoming season
- July–September: Feature completion, integration testing, performance optimization
- October: Code freeze preparation, final stabilization
- November–December: Code freeze, war room, firefighting
The problem? Most teams don't realize they're behind until September. By then, it's too late to course-correct.
Why E-Commerce Teams Miss Deadlines
Having worked with engineering teams across multiple e-commerce companies, we see the same patterns:
Invisible Dependencies
The new product recommendation engine depends on the updated catalog API, which depends on the data pipeline migration, which depends on the infrastructure team. None of this is visible in sprint velocity charts.
Optimistic Lead Times
Teams estimate based on coding time but forget about code review queues, QA cycles, staging environment contention, and the back-and-forth with product on edge cases. The actual lead time from first commit to production is often 3-5x longer than the coding estimate.
Unplanned Compliance Work
PCI DSS 4.0 recertification, GDPR data subject requests, accessibility requirements — these land on engineering plates without warning and consume weeks of capacity. The Adobe Digital Economy Index notes that compliance-related engineering work spikes ~30% in Q3 as retailers prepare for peak season audits.
Technical Debt Compounding
That "quick fix" from last year's Black Friday is now a fragile component that breaks every time someone touches it. The team spends more time working around it than it would take to fix it, but there's never "time" for the fix.
The Metrics Framework for Seasonal Delivery
Deployment Frequency: Your Leading Indicator
Deployment frequency is the single best leading indicator of delivery health. Here's why:
- Declining deployment frequency in April–June means teams are struggling with large, complex changes that take longer to integrate
- Stable or increasing deployment frequency means teams are shipping small, incremental changes — which is both faster and safer
- Sudden drops signal blockers: environment issues, review bottlenecks, or team members pulled to other priorities
Track deployment frequency weekly, broken down by team and service. If your checkout team's deployment frequency drops 40% in May, that's a signal to investigate now, not in September.
PanDev Metrics tracks deployments across GitLab, GitHub, Bitbucket, and Azure DevOps, giving you real-time visibility without manual reporting.
Lead Time for Changes: Predict Your Actual Delivery Date
If your average lead time for changes is 5 days, and you have 30 features left to ship, you need at least 150 developer-days of capacity. But that assumes:
- No increase in review time as more code is in flight
- No staging environment contention
- No context-switching between features and bug fixes
In practice, lead time tends to increase as you approach the deadline because more changes are in flight simultaneously, review queues get longer, and testing environments become contested.
Track lead time trends weekly. If lead time is increasing month over month, your delivery date is slipping even if sprint velocity looks stable.
Change Failure Rate: The Quality Gate
The temptation before high season is to cut corners on quality to meet deadlines. Engineering metrics make the cost of this visible:
- A rising change failure rate means more rollbacks, more hotfixes, and more time spent on rework
- Each failure during the pre-season adds unplanned work that pushes other features back
- A high change failure rate going into code freeze means you'll spend November fixing bugs instead of monitoring performance
Set a target: if change failure rate exceeds a threshold (many e-commerce teams use ~10-15%), slow down and invest in testing rather than pushing more features. This aligns with findings from the Shopify engineering blog, where teams enforce a hard quality gate before their Black Friday code freeze.
Focus Time: Are Developers Actually Building?
E-commerce companies are meeting-heavy. Product reviews, design syncs, stakeholder updates, cross-team coordination — by the time a developer sits down to code, half the day is gone.
PanDev Metrics' IDE heartbeat tracking shows actual Focus Time — uninterrupted blocks of coding activity. If your developers are averaging 90 minutes of Focus Time per day, no amount of project management optimization will help. You need to protect their deep work time.
Compare Focus Time across teams and time periods:
- If Focus Time drops as you approach the deadline, meetings and context-switching are killing productivity
- If Focus Time is consistently low for a specific team, investigate their meeting load and interrupt frequency
- Track Activity Time alongside Focus Time to see the full picture of developer engagement
MTTR: Your Black Friday Insurance
Mean Time to Recovery during peak traffic determines whether a checkout bug costs you thousands or millions.
Before high season:
- Measure current MTTR for critical services (checkout, payments, product catalog, search)
- Identify services with MTTR above your target
- Invest in monitoring, runbooks, and automated rollback for those services
If your payment service MTTR is 45 minutes, that's potentially 45 minutes of lost transactions during peak traffic. According to Salesforce data, top e-commerce sites process ~$1M+ per minute during Black Friday peak hours. Measure it, set targets, improve it.
Building a Pre-Season Engineering Dashboard
Create a dashboard that your entire leadership team can see, updated automatically:
Delivery Health:
- Deployment frequency by team (weekly trend)
- Lead time for changes (weekly trend)
- Features completed vs. planned (cumulative)
Quality:
- Change failure rate by service (weekly)
- Open bugs by severity
- Test coverage trends for critical services
Team Health:
- Focus Time averages by team
- Activity distribution (feature work vs. bug fixes vs. maintenance)
- On-call burden distribution
Readiness:
- MTTR for Tier 1 services
- Deployment pipeline reliability
- Rollback success rate
PanDev Metrics provides these views out of the box, with integrations into Jira and ClickUp for correlating engineering metrics with project tracking data.
The 6-Month Countdown: A Practical Timeline
T-6 Months: Establish Baselines
Connect PanDev Metrics to your development stack:
- Git platforms (GitLab, GitHub, Bitbucket, Azure DevOps)
- IDE plugins across all development teams
- Project tracking (Jira, ClickUp)
Measure everything for 2-4 weeks without making changes. Understand your current deployment frequency, lead time, change failure rate, and Focus Time baselines.
T-5 Months: Identify Bottlenecks
Analyze the baseline data:
- Which teams have the longest lead times? Why?
- Where does code wait the longest — review, QA, staging, or deployment?
- Which services have the highest change failure rates?
- Are there teams with significantly lower Focus Time?
Address the biggest bottlenecks first. Often, the highest-impact improvements are organizational, not technical: reducing review queue times, allocating dedicated testing resources, or protecting developer Focus Time.
T-4 Months: Optimize and Monitor
Implement changes and track their impact:
- If review was the bottleneck, have you reduced review wait time?
- If staging environment was the bottleneck, did the new environment provisioning help?
- Is deployment frequency increasing?
- Is lead time decreasing?
T-3 Months: Feature Completion Tracking
Start mapping metrics to specific feature delivery:
- Which features are on track based on current lead time trends?
- Which features are at risk?
- Where should you add resources or reduce scope?
This is where financial analytics become valuable. PanDev Metrics' financial features help you understand the cost of each feature and make informed trade-off decisions.
T-2 Months: Stabilization Focus
Shift focus from features to stability:
- Change failure rate should be declining
- MTTR improvements should be in place for critical services
- Performance testing results should validate capacity for peak traffic
T-1 Month: Code Freeze Preparation
Final metrics check:
- All critical features deployed and validated
- Change failure rate at or below target
- MTTR within acceptable range for all Tier 1 services
- Rollback procedures tested and documented
What to Do When Metrics Show You're Behind
It's month T-4 and the data clearly shows you won't deliver everything planned. Now what?
Option 1: Reduce scope. Use your metrics to identify which features are furthest behind and negotiate with product on what can wait until next season. Data-driven scope discussions are far more productive than opinion-based arguments.
Option 2: Reduce lead time. If lead time is your biggest problem, look for ways to parallelize work, reduce review wait times, or simplify deployment processes. Even a 20% reduction in lead time can recover weeks of delivery capacity.
Option 3: Increase Focus Time. If developers are spending less than 2 hours per day in focused coding, every hour you reclaim has an outsized impact. Cancel recurring meetings, batch communications, and protect deep work blocks.
Option 4: Add capacity strategically. If you're going to bring in additional engineers, use your metrics to identify exactly where they're needed. Adding developers to a team that's bottlenecked on review won't help — adding reviewers will.
After the Season: The Post-Mortem That Matters
Once the season is over, your metrics tell the real story:
- How accurate were your delivery estimates?
- Where did the biggest delays actually occur?
- How did code quality hold up under deadline pressure?
- Which teams maintained healthy metrics and which struggled?
Use this data to plan next year. The e-commerce engineering calendar is predictable — the only question is whether you'll use data to navigate it better each year.
Ready to accelerate your e-commerce feature delivery? PanDev Metrics — engineering intelligence for teams that can't afford to miss their deadlines.