EdTech: Productivity Metrics for Educational Platform Teams

EdTech platforms are deceptively complex engineering challenges. HolonIQ's global EdTech funding data shows the sector attracted over $10 billion annually in recent years — and that capital demands engineering output that matches investor expectations. On the surface, it's "just" a learning management system or an online course platform. Underneath, it's real-time video streaming, adaptive learning algorithms, content management for thousands of courses, assessment engines, analytics dashboards, accessibility compliance, and integrations with school IT systems that haven't been updated since 2010.
EdTech CTOs manage teams that span frontend, backend, content engineering, data science, DevOps, and often a dedicated integrations team. The work ranges from highly creative (building engaging learning experiences) to deeply technical (video transcoding pipelines, real-time collaboration engines) to frustratingly mundane (integrating with yet another LMS via a poorly documented API).
Engineering metrics help you manage this complexity, allocate resources wisely, and deliver the platform improvements that actually move learning outcomes.
{/* truncate */}
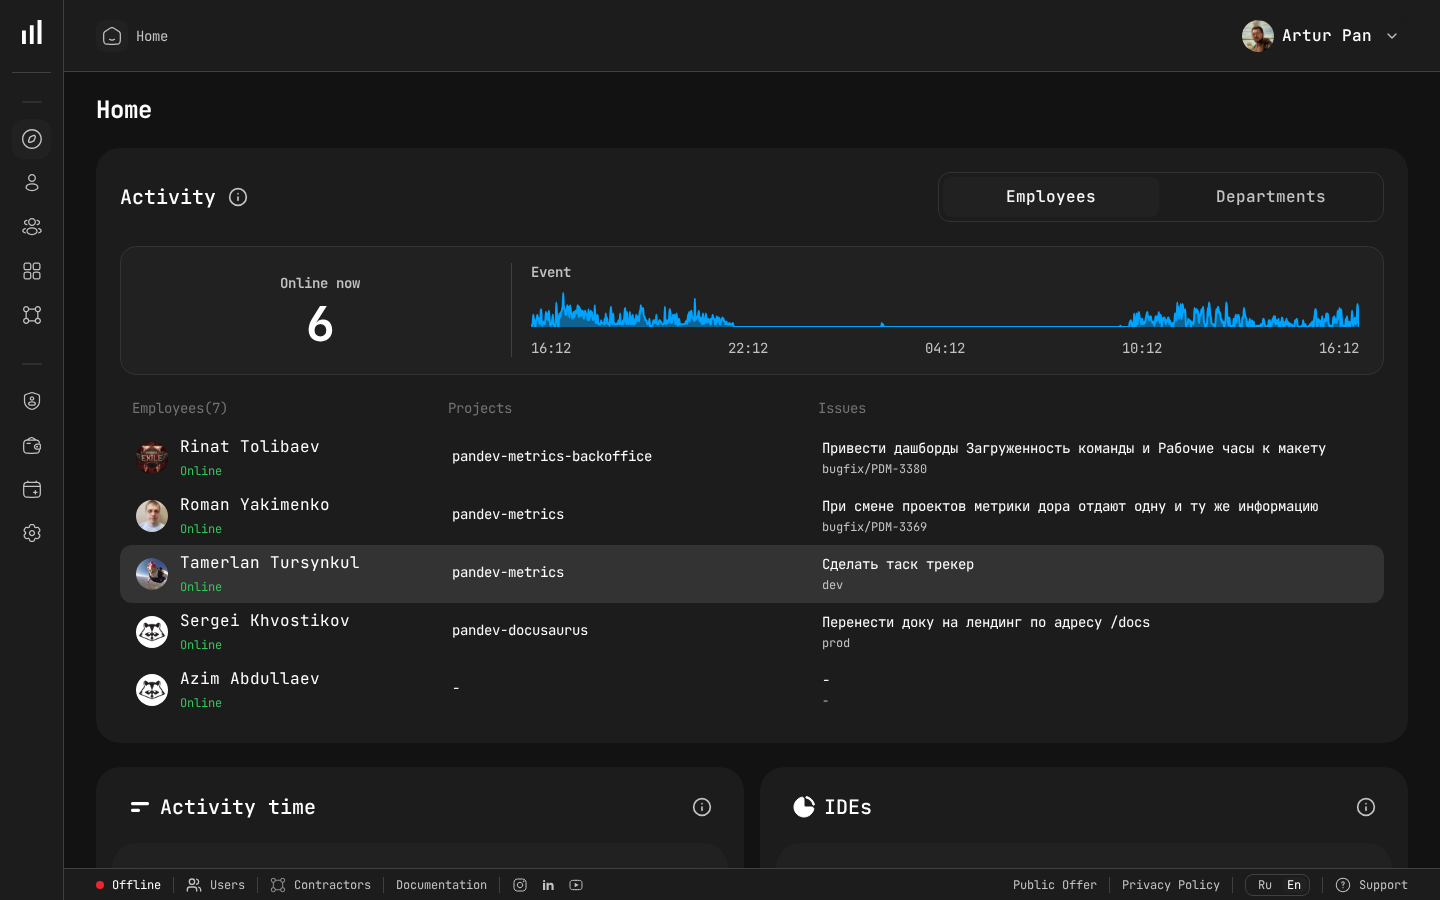
Engineering dashboard showing team activity and project status.
The EdTech Engineering Landscape
What Makes EdTech Different
EdTech engineering organizations face a specific set of challenges:
Seasonal demand patterns. Usage spikes at the start of academic terms, during exam periods, and drops during holidays. Your infrastructure and feature delivery need to anticipate these cycles — much like e-commerce, but with different timing.
Diverse user populations. Students, teachers, administrators, parents, and content creators all use your platform differently. Each group has different needs, different technical literacy levels, and different tolerance for bugs.
Accessibility is non-negotiable. Educational platforms often must comply with WCAG standards, Section 508 (US), and EN 301 549 (EU). The UNESCO EdTech Framework emphasizes that inclusive access is a foundational principle, not an add-on. This isn't a nice-to-have — it's a legal requirement for platforms used by educational institutions.
Content and code are intertwined. Unlike most software products, EdTech platforms have a content layer that's as complex as the code layer. Content authoring tools, content delivery networks, multimedia processing pipelines — these require engineering resources but don't fit neatly into traditional software metrics.
Integration complexity. Schools and universities use dozens of systems: SIS (Student Information Systems), LTI-compliant LMS platforms, SSO via SAML/LDAP, grade passback systems, and more. Each integration is unique and often poorly documented.
Long feedback loops. You can A/B test a checkout button and see results in hours. Testing whether a new learning feature improves student outcomes takes weeks or months.
The Typical EdTech Engineering Organization
A mid-stage EdTech company (Series B+) typically has:
- Platform team: Core infrastructure, APIs, authentication, scalability
- Product teams (2-4): Learning experience, assessments, content tools, analytics
- Content engineering team: Authoring tools, content delivery, multimedia processing
- Data/ML team: Learning analytics, adaptive algorithms, recommendations
- Integrations team: Third-party connections, LTI, SIS integrations
- DevOps/SRE: Infrastructure, deployment, monitoring
Each team has different work patterns, different deployment cadences, and different definitions of "done."
Metrics Framework for EdTech
Platform Health Metrics
Your platform is the foundation everything else is built on. Track:
Deployment Frequency: How often does each team deploy? For platform and product teams, daily or multiple-times-daily deployment indicates healthy CI/CD practices. For the integrations team, deployment frequency might be lower because each integration requires specific testing with partner systems.
PanDev Metrics tracks deployment frequency across all your Git platforms (GitLab, GitHub, Bitbucket, Azure DevOps), broken down by team and repository.
Lead Time for Changes: From first commit to production. In EdTech, lead time often includes:
- Code review
- QA testing (including accessibility testing)
- Staging environment validation
- Content review (for changes affecting content display)
- Partner validation (for integration changes)
Measure time at each stage to find bottlenecks. If accessibility testing adds 3 days to every deployment, invest in automated accessibility testing tools.
Change Failure Rate: What percentage of deployments cause issues? In EdTech, "issues" include:
- System errors and bugs
- Content rendering problems
- Accessibility regressions
- Integration breakages
- Performance degradation during peak usage
Track change failure rate by team and by change type. If integration deployments have a 20% failure rate while product deployments have 3%, focus your testing investment on integration code.
MTTR: How quickly do you recover from incidents? During exam periods, MTTR is critical — a platform outage during a timed exam affects student grades and institutional trust. Track MTTR by service tier and by calendar period (normal vs. peak usage).
Developer Productivity Metrics
Focus Time: EdTech companies, especially those with strong pedagogical missions, tend to have meeting-heavy cultures. Product reviews, learning design sessions, content review meetings, partner calls, and cross-functional syncs can consume most of the day.
PanDev Metrics' IDE heartbeat tracking reveals actual Focus Time — uninterrupted coding blocks. Compare across teams:
- Platform team Focus Time should be highest (they have fewer cross-functional dependencies)
- Product teams may have moderate Focus Time (balanced between building and collaborating)
- Integration teams often have the lowest Focus Time (constant communication with partners)
If any team's Focus Time is consistently below 2 hours per day, investigate their meeting load.
Activity Time Distribution: Where is engineering effort going?
For each team, track the split between:
- New feature development — building new platform capabilities
- Bug fixes — addressing reported issues
- Maintenance — keeping existing systems running
- Integration work — connecting with third-party systems
- Content tooling — building and maintaining content authoring and delivery
- Technical debt — improving code quality, migrating systems, upgrading dependencies
This distribution tells you whether your investment priorities match your actual resource allocation. If leadership prioritizes "new learning experiences" but 60% of engineering time goes to maintenance and integration work, there's a disconnect that needs to be addressed with data.
Content Engineering Metrics
Content engineering is unique to EdTech and often underserved by standard metrics:
Content Pipeline Throughput: How quickly can new content (courses, assessments, multimedia) move from authoring to availability on the platform? This isn't purely an engineering metric, but engineering constraints (processing time, review workflows, CDN propagation) are often the bottleneck.
Track engineering Activity Time spent on content pipeline improvements versus content pipeline maintenance. If the ratio shifts toward maintenance, the content infrastructure needs investment.
Content Delivery Performance: For platforms with multimedia content (video lectures, interactive simulations), track:
- Processing pipeline reliability (what percentage of uploaded content processes successfully?)
- Time to availability (how long after upload is content accessible to learners?)
- Delivery performance (load times, buffering rates during peak usage)
Integration Health Metrics
Integrations are often the most fragile part of an EdTech platform:
Integration Failure Rate: What percentage of data exchanges with partner systems fail? Track by integration partner — one poorly maintained SIS integration can consume weeks of engineering time.
Integration Maintenance Burden: How much Activity Time goes to maintaining existing integrations vs. building new ones? If maintenance dominates, consider investing in more robust integration infrastructure (better error handling, automated testing, standardized connectors).
Lead Time for New Integrations: How long does it take to build and deploy a new integration? If your sales team promises integrations in 2 weeks but engineering data shows the average is 6 weeks, you have an expectation mismatch that causes friction.
Seasonal Planning With Metrics
EdTech usage follows academic calendars. Engineering metrics help you prepare:
Pre-Semester Sprint (4-8 Weeks Before Term Start)
Focus metrics on:
- Deployment frequency acceleration — ship critical features before the term starts
- Change failure rate — maintain quality even as you accelerate
- Performance metrics — ensure the platform handles expected enrollment
- Integration health — verify all partner integrations before institutions depend on them
During Term
Focus metrics on:
- MTTR — fast recovery is critical when students and teachers are actively using the platform
- Change failure rate — zero tolerance for regressions during active use
- Bug fix lead time — how quickly are reported issues resolved?
- Focus Time — protect developers from being pulled into support escalations
Between Terms
Focus metrics on:
- Technical debt activity — this is the time to invest in platform improvements
- Activity distribution — shift toward maintenance, infrastructure, and debt reduction
- Deployment frequency — may decrease as teams work on larger, more complex improvements
- Research and experimentation — data/ML teams should have dedicated time for exploration
Building the EdTech Engineering Dashboard
CTO View
Platform Health:
- Deployment frequency trend (all teams)
- Change failure rate (last 4 weeks)
- MTTR for Tier 1 services
- Upcoming peak usage period readiness
Team Allocation:
- Activity distribution across all teams
- Focus Time averages by team
- Headcount vs. output trends
Financial:
- Engineering cost per product area
- Cost trends over time
- Resource allocation efficiency (from PanDev Metrics financial analytics)
Engineering Manager View
Team Metrics:
- Team DORA metrics with trends
- Focus Time per developer
- Code review metrics (wait time, throughput)
- Activity distribution (feature vs. bug fix vs. maintenance)
Delivery:
- Features in pipeline with estimated completion (based on lead time data)
- Blocked items and reasons
- Cross-team dependencies
Individual Developer View
Personal Metrics:
- Focus Time trends (help developers protect their deep work time)
- Activity distribution across projects
- Deployment contributions
- Code review activity
Developers should see their own metrics as tools for self-improvement, not surveillance.
Accessibility and Compliance Tracking
Accessibility compliance is a legal and ethical requirement for EdTech. Engineering metrics support this:
Accessibility Testing Coverage: Track what percentage of deployments include accessibility testing. If it's not 100%, identify why and address the gap.
Accessibility Bug Fix Lead Time: How quickly are accessibility issues resolved after discovery? These should be prioritized as highly as functional bugs — a feature that students with disabilities can't use is a broken feature.
Activity Time on Accessibility: Track engineering time spent on accessibility improvements, not just fixes. This demonstrates ongoing commitment to inclusive design.
Data Privacy Considerations
EdTech platforms handle student data, which is protected by some of the strictest privacy regimes in any industry:
- FERPA (US) — Federal Educational Rights and Privacy Act
- COPPA (US) — Children's Online Privacy Protection Act (if serving under-13 students)
- GDPR (EU) — General Data Protection Regulation
- State and national laws — varying by jurisdiction
For engineering metrics, this means:
- On-premise deployment may be required if your engineering data could contain references to student data. PanDev Metrics supports full on-premise installation.
- Data minimization — engineering metrics should capture activity patterns, not code content or student data.
- Access controls — LDAP/SSO integration ensures only authorized personnel access engineering metrics.
Cross-Functional Collaboration Metrics
EdTech development requires tight collaboration between engineering, instructional design, content teams, and partner relations. Metrics can illuminate collaboration health:
Cross-Repository Activity: PanDev Metrics tracks when developers work across multiple repositories. High cross-repository activity in an EdTech context might indicate healthy collaboration (engineers helping content teams) or unhealthy context-switching (engineers pulled in too many directions).
Handoff Time: How long do design-to-engineering and content-to-engineering handoffs take? Long handoff times indicate process problems or capacity mismatches.
Integration Team Responsiveness: How quickly does the integration team respond to new integration requests? If sales is closing deals that depend on integrations the team can't deliver on time, metrics make this gap visible and negotiable.
Implementation Roadmap
Month 1: Foundation
- Deploy PanDev Metrics (on-premise if handling student data)
- Connect Git platforms and project tracking tools
- Deploy IDE plugins across all engineering teams
- Collect baseline data
Month 2: Visibility
- Build team-level dashboards
- Share DORA metrics with team leads
- Identify Focus Time patterns
- Map activity distribution
Month 3: Optimization
- Address the biggest bottlenecks identified by metrics
- Set up seasonal preparation dashboards
- Establish integration health monitoring
- Begin financial analytics tracking
Month 4+: Continuous Improvement
- Quarterly metrics reviews with leadership
- Seasonal preparation playbooks informed by historical data
- Data-driven resource allocation decisions
- Integration health management using trend data
The Bigger Picture
EdTech companies exist to improve learning outcomes. Every engineering decision — how you allocate resources, which features you prioritize, how you manage technical debt — ultimately affects whether students learn better.
Engineering metrics connect your engineering operations to this mission. When you can see that 40% of engineering time goes to maintaining a legacy content pipeline, you can make the case to invest in modernization — not because it's technically interesting, but because it frees capacity to build features that improve learning.
When you can see that your integrations team is overwhelmed, you can hire or redistribute resources before the next integration failure disrupts a school district's semester.
When you can see that Focus Time is declining, you can protect your developers' ability to do their best work — which ultimately means building a better platform for learners.
Building an educational platform? PanDev Metrics — engineering intelligence for EdTech teams, with DORA metrics, IDE activity tracking, and the visibility to build platforms that improve learning.