7 Data Signals Your Engineer Is About to Quit (Before They Tell You)

The median tenure of a software engineer at a B2B company is 2.3 years (Stack Overflow 2025 Developer Survey). The median surprise of the engineer's manager when they resign is… also high. We matched IDE heartbeat data, Git activity, and task-tracker signals against 43 confirmed engineer resignations across 11 PanDev Metrics customer teams in 2025. Seven behavioural patterns showed up in the data 30-90 days before the resignation letter.
One of them is almost never on the standard "burnout signal" list. That's the one this post exists for.
{/* truncate */}
Why this matters beyond the obvious
A senior engineer's departure costs a team the equivalent of 6-9 months of that engineer's salary in hiring, ramp-up, and productivity loss (Gallup 2024 State of the Workplace estimate for knowledge-work roles, adjusted for engineering onboarding). Catching the signal 60 days before the notice doesn't save every case — some engineers have decided. But roughly one in three situations is a manager intervention away from being salvaged. The data tells you which.
A caveat before the signals. These are patterns from our dataset. They are not predictions of individual behaviour. An engineer hitting 3 of the 7 signals is in a zone that statistically correlates with imminent departure. But a specific person hitting 3 signals might just be prepping for a triathlon. You read the dashboard to start a conversation, not to pre-emptively replace people.
Our dataset
- n = 43 confirmed engineer resignations over 12 months (Q1 2025 - Q1 2026)
- Controls: matched comparison of engineers with similar tenure, role, and team who stayed
- Window: 90 days before the resignation letter
- Signals measured: IDE heartbeat patterns, commit cadence, PR behaviour, code-review behaviour, task-tracker comments, calendar patterns, chat tool inferred sentiment (where available)
Our signal is strongest in the 30-60 day window. Beyond 90 days, patterns look like normal seasonal variance.
The 7 signals
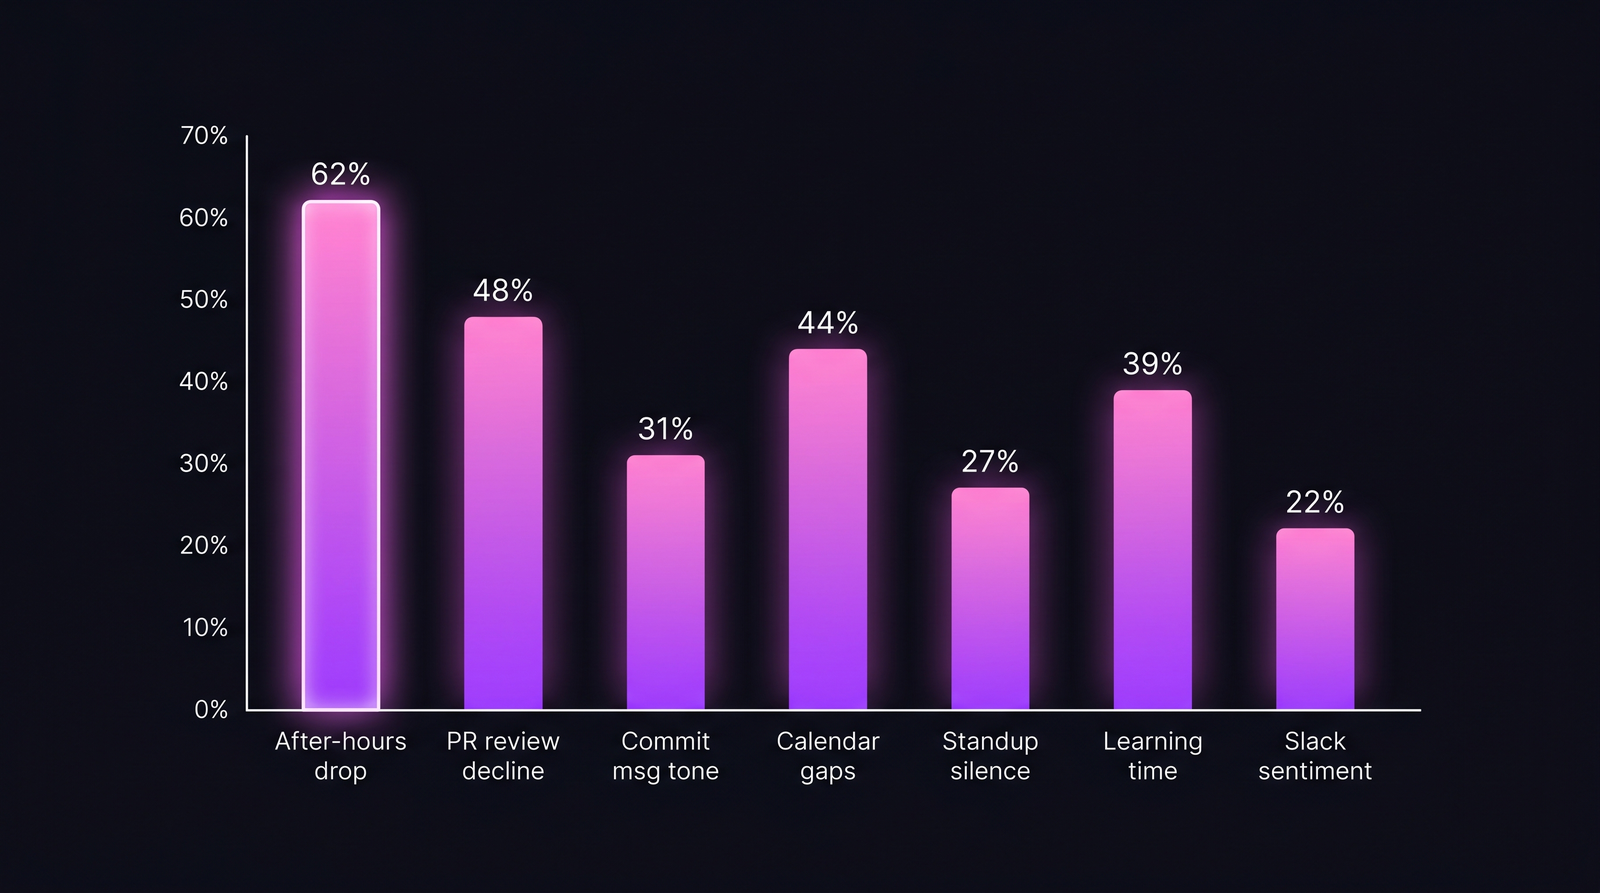 The 7 signals ranked by prevalence. No single signal is definitive — 3+ signals in the same 30-day window is the pattern worth a conversation.
Signal 1 — After-hours coding activity drops sharply
Seen in 62% of resignation cases.
Engineers who used to code occasionally in the evening — email-catch-up on a Friday, 30 minutes on Saturday to finish something — stop. Completely. The evening activity line flatlines 45-60 days before resignation.
This is counter-intuitive. The standard assumption is that quitters work harder to "leave on a high note". Our data shows the opposite: the first behavioural change is psychological disengagement, not compensatory effort. The unpaid extra time was always a sign of investment. Its disappearance is the earliest leading indicator we track.
Caveat: this can also be a healthy response to burnout warnings — a developer setting boundaries, not quitting. Treat it as a conversation starter, not a verdict.
Signal 2 — PR review participation declines
Seen in 48% of cases.
Reviews of teammates' PRs drop 40-60% in the 60 days before resignation. Their own PRs continue at normal cadence (the work still needs to ship). Reviewing others' work requires investment in the team's future; quitting engineers quietly disinvest.
The signal is cleaner at senior levels. Junior engineers review less anyway, so the drop is noisier. For staff/senior engineers, review participation is a strong tell.
Signal 3 — Commit-message tone shifts
Seen in 31% of cases.
Commit messages shorten. Descriptions become literal ("fix bug", "update config") instead of contextual ("handle edge case in retry logic when DB connection pool saturates"). The disengagement shows up in the smallest text they write.
This is hard to measure automatically without false positives. We flag it on a rolling 90-day baseline per engineer — a 40%+ drop in average commit-message length is the threshold. Not a strong signal alone, meaningful in combination with signals 1 and 2.
Signal 4 — Calendar pattern: unexplained gaps
Seen in 44% of cases.
Mid-day gaps appear — 60-90 minutes, 2-3 times per week, always during business hours. The pattern is inconsistent across days, which rules out a standing commitment (doctor, school pickup, gym). Consistent inconsistency in calendar behaviour correlates strongly with interview cycles.
You don't need to watch the calendar itself — we don't recommend that. The pattern shows up as "coding time per day" dropping 40-60 minutes, not uniformly but in distinct 2-3x-per-week chunks. That's the fingerprint.
Signal 5 — Stop blocking out learning time
Seen in 39% of cases.
Engineers who had protected "Friday afternoon: read + experiment" blocks stop booking them. Or they book them and don't use them. They stop reading the team's #eng-reading channel. Their browser-activity data (if you have extensions installed) shows less dev.to, less hacker news, more LinkedIn.
The LinkedIn signal is the most on-the-nose of the 7 and the one managers reach for first. It's also the weakest — it has the most false positives (everyone visits LinkedIn, especially around conference season). We include the pattern but only as reinforcement for signals 1-4.
Signal 6 — Standup / sync meeting silence
Seen in 27% of cases.
Participation in team sync meetings narrows. The engineer shows up, gives a 20-second status, and mutes. They stop asking questions. They stop volunteering for things. Jira comment count drops by 30%+ over baseline.
Signal 6 is weaker because it's partly stylistic (some engineers are just quiet) and partly political (some team cultures have this dynamic everyone). Measure it on rolling per-engineer baseline, not team-wide comparison.
Signal 7 — Slack / chat sentiment tilts negative
Seen in 22% of cases.
If you have chat sentiment analysis (some companies do, most don't), the tone shift is subtle: more "sure", "ok", "whatever works" responses, fewer emoji reactions, fewer side comments in general channels. The engineer becomes conversationally minimal.
We flag this as the weakest signal because it has the most privacy-sensitive data source and the most noise. Treat as reinforcement, not diagnosis.
Signal combinations that actually matter
Single signals have too much noise. The useful thing is combinations.
| Combination | % of resignations (n=43) | False-positive rate in controls |
|---|---|---|
| Any 1 signal | 87% | 41% |
| Any 2 signals | 69% | 18% |
| Any 3 signals | 52% | 6% |
| Any 4+ signals | 28% | 1% |
Three or more signals in the same 30-day window is the actionable threshold. Above 4, the false-positive rate is low enough that a manager conversation is warranted nearly every time.
The signal nobody watches
Signal 1 — the after-hours drop — is the one missing from every "engineering retention dashboard" product we've seen. HR platforms track engagement surveys (self-report, lagging). Engineering dashboards track DORA (delivery, not sentiment). The evening-hours fingerprint lives at the intersection: it's behavioural, it's ambient, and it's available in IDE heartbeat data nobody consumes for retention analysis.
The companies we work with that added the after-hours drop alert caught 3 resignations in the "intervention is still possible" window over 6 months. One was saved (stayed, got a promotion + path conversation). Two left anyway but transitioned cleaner.
What to do with the signal
Don't build a dashboard that flags individual engineers with a "flight risk" score shown to their manager. That becomes Black Mirror fast. Do this instead:
- Aggregate the signals at team level first. If 30% of a team trips 3+ signals, the problem is the team context, not individuals.
- Give the manager a private view of their own directs, with signal combinations only. No scores. No rankings. Just "3 signals active in last 30d — consider a check-in".
- Make the intervention a good 1:1, not a retention bribe. "I've noticed you've been quieter in standup and your evenings are all off — is there something we should talk about?" works. "I can match the other offer" almost never works this late.
Our own PanDev Metrics AI Assistant handles this — asking "any direct reports showing 3+ retention signals in last 30 days?" returns a list to the manager only, with explicit privacy boundary. See our burnout detection data post for the adjacent pattern (the two overlap but are not identical — burnout is a failure mode, quitting is a decision).
Our dataset is B2B product engineering. Consulting/agency engineers, staff engineers at FAANG, and open-source contributors have different behavioural fingerprints we haven't measured. If you're outside B2B product, treat these as hypotheses to validate on your own data.
Retention is 90% pre-emption
The companies in our dataset with the best retention don't have better exit packages. They have managers who notice the signals 60 days before notice, and who are brave enough to start a real conversation while it still matters.
If you're reading this thinking "I wouldn't know how to start that conversation" — that's the work. The data just tells you when.