Engineering Team ROI: How to Calculate and Present to Business

Every quarter, CTOs face the same uncomfortable meeting. The CEO asks: "We spent $2.4M on engineering last quarter. What did we get for it?" And the answer is usually a list of shipped features — not a financial return.
Engineering is the largest cost center in most technology companies, yet it's the one with the least financial accountability. Marketing can show customer acquisition cost. Sales can show revenue per rep. Engineering shows... velocity points? McKinsey's analysis of software developer productivity highlights this gap: engineering output is measurable, but most organizations haven't built the systems to do it.
It's time to change that.
{/* truncate */}
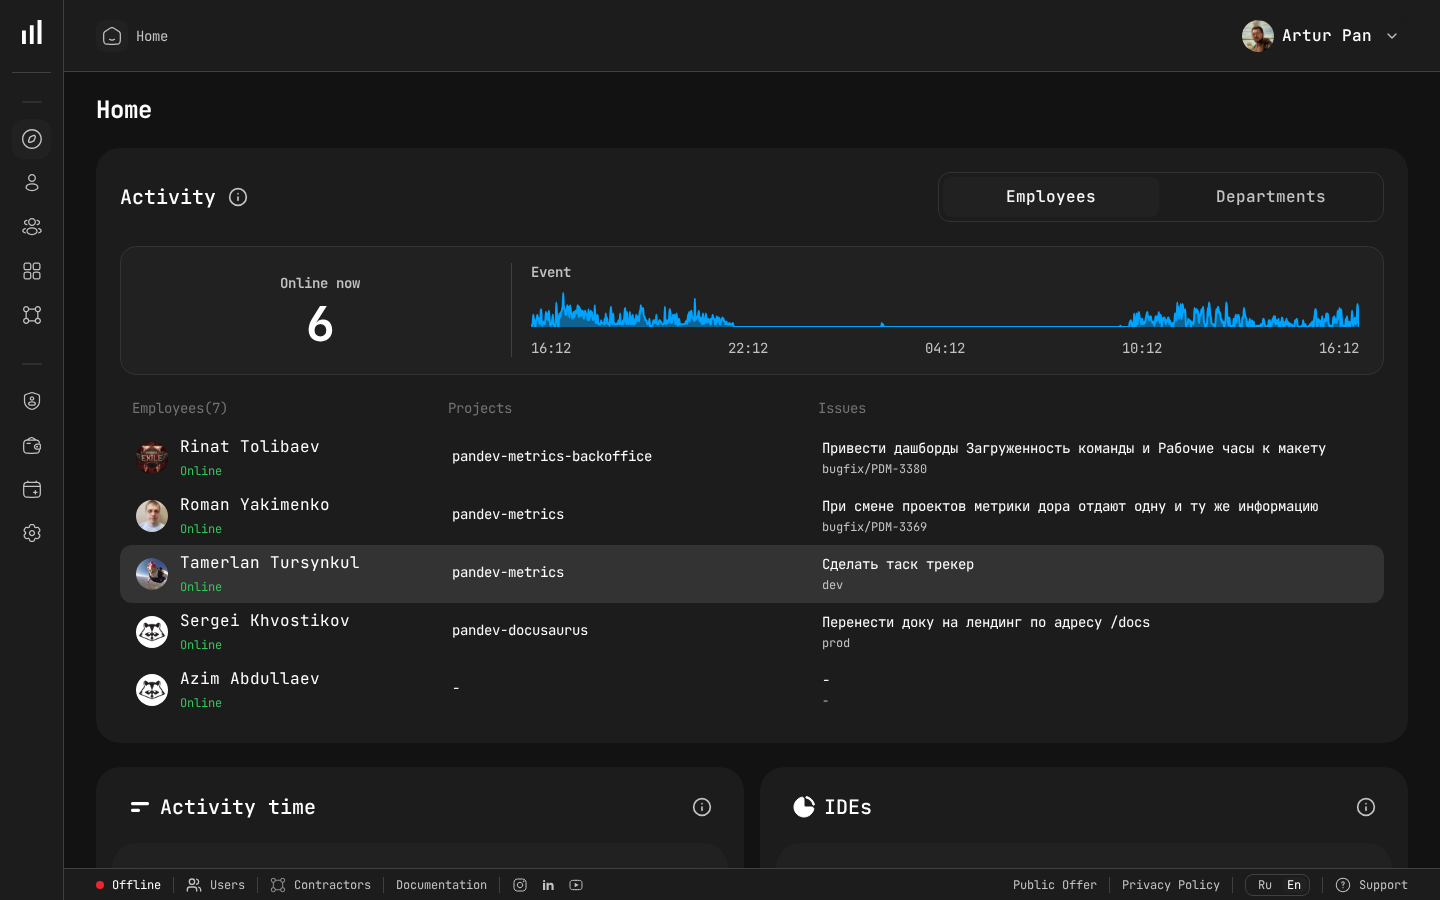
Engineering dashboard showing team activity — the numerator in ROI calculations.
Why Engineering ROI Is Hard (But Not Impossible)
Engineering ROI is genuinely harder to calculate than sales or marketing ROI. Here's why:
- Indirect value creation — Engineering doesn't close deals directly; it builds the product that enables sales
- Long feedback loops — A feature built in Q1 might not generate measurable revenue until Q3
- Maintenance is invisible — Keeping systems running and secure creates enormous value but generates no new revenue
- Attribution is complex — When revenue grows 20%, how much was engineering vs. sales vs. marketing?
These are real challenges, but they're not excuses. CFOs and CEOs don't need perfect attribution — they need a defensible framework that shows engineering investment connects to business outcomes.
The Engineering ROI Framework
Here's a practical framework that works for board-level conversations.
The Core Formula
Engineering ROI = (Value Generated - Engineering Cost) / Engineering Cost × 100%
The engineering cost side is relatively straightforward. The value generated side requires breaking engineering output into categories.
Calculating Engineering Cost
Total engineering cost includes:
Engineering Cost = Salaries + Benefits + Contractors + Tools + Infrastructure + Facilities_Allocation
Example for a 30-person engineering team:
| Cost Category | Annual Cost |
|---|---|
| Salaries (30 engineers, avg $140K) | $4,200,000 |
| Benefits (25% of salaries) | $1,050,000 |
| Contractors / outsourcing | $360,000 |
| Tools and licenses | $180,000 |
| Cloud infrastructure | $480,000 |
| Office / facilities allocation | $270,000 |
| Total Engineering Cost | $6,540,000 |
Calculating Value Generated
Engineering value falls into four categories:
1. Revenue-Enabling Features
Features that directly enable new revenue or expand existing revenue. This is the most straightforward category.
Revenue Feature Value = New ARR Attributed to Feature × Attribution_Percentage
Example: Your team built an enterprise SSO feature. Since launch, 12 enterprise deals worth $720K ARR cited SSO as a requirement. If engineering gets 40% attribution (sales and marketing get the rest):
Value = $720,000 × 0.40 = $288,000
2. Retention and Churn Prevention
Engineering work that prevents customers from leaving. Performance improvements, reliability upgrades, and requested features that retain at-risk accounts.
Retention Value = Saved_ARR × Churn_Prevention_Rate × Attribution_Percentage
Example: Performance improvements reduced page load time from 4s to 1.2s. Customer success reports that 8 accounts ($340K ARR) were considering leaving due to performance issues and are now satisfied.
Value = $340,000 × 0.70 × 0.50 = $119,000
3. Efficiency Gains
Internal tools, automation, and process improvements that reduce costs elsewhere in the organization.
Efficiency Value = Hours_Saved × Hourly_Cost_of_Saved_Labor
Example: Engineering built an automated billing reconciliation tool. The finance team previously spent 60 hours/month on manual reconciliation ($75/h loaded cost).
Value = 60h × 12 months × $75 = $54,000/year
4. Platform and Infrastructure Value
This is the hardest to quantify but often the most valuable. Includes: keeping systems running (uptime), security compliance, scalability that enables growth, and technical debt reduction that accelerates future development.
Platform Value = Downtime_Prevention_Value + Compliance_Value + Velocity_Impact
Example approach: If your platform generates $50K/day in revenue and your SRE team maintains 99.95% uptime (vs. industry average of 99.5%), the prevented downtime is:
Prevented downtime = (99.95% - 99.5%) × 365 days = 1.64 days/year Value = 1.64 × $50,000 = $82,000/year
Putting It All Together
| Value Category | Annual Value |
|---|---|
| Revenue-enabling features | $1,440,000 |
| Retention / churn prevention | $595,000 |
| Efficiency gains | $216,000 |
| Platform / infrastructure value | $820,000 |
| Total Value Generated | $3,071,000 |
Engineering ROI = ($3,071,000 - $6,540,000) / $6,540,000 × 100% = -53%
Wait — negative ROI? Yes, and that's okay for this example. Here's why.
Interpreting Engineering ROI: The Nuances
A raw ROI calculation for engineering will almost always look negative or modest because:
- Revenue attribution is conservative — giving engineering 30-40% credit for features that enable 100% of the revenue understates the contribution
- Compounding value isn't captured — the SSO feature doesn't just generate $288K in year one; it generates recurring revenue for years
- Counterfactual value is missing — what would happen to the business with no engineering? Revenue goes to zero
The Lifetime ROI Adjustment
For a more accurate picture, apply a lifetime multiplier to revenue-enabling features:
Adjusted Revenue Value = Annual Revenue Impact × Expected Customer Lifetime (years) × NPV_Factor
If the average customer stays 4 years and you use a 10% discount rate:
Adjusted value = $1,440,000 × 3.17 (NPV of 4-year stream at 10%) = $4,564,800
With this adjustment:
Adjusted ROI = ($6,245,800 - $6,540,000) / $6,540,000 × 100% = -4.5%
Still slightly negative, but much closer to breakeven. And this is a conservative estimate for a 30-person team at a growing SaaS company. Higher-performing teams with better product-market fit routinely achieve positive engineering ROI.
How to Present Engineering ROI to the CEO
Calculating ROI is half the battle. Presenting it effectively is the other half. Here's a framework that works.
Slide 1: The Investment Summary
Keep it simple. Show total engineering spend and break it into categories the CEO cares about.
Total Engineering Investment: $6.54M
├── New Feature Development: 45% ($2.94M)
├── Maintenance and Reliability: 25% ($1.64M)
├── Technical Debt / Platform: 20% ($1.31M)
└── Support and Incidents: 10% ($0.65M)
Slide 2: The Value Created
Map engineering output to business outcomes, not technical deliverables.
Instead of: "Shipped 47 features, closed 312 bugs, deployed 1,247 times"
Say: "Engineering directly enabled $1.44M in new ARR, prevented $595K in churn, and saved $216K in operational costs. Total measurable impact: $3.07M against $6.54M investment."
Slide 3: Efficiency Trends
Show that engineering is getting more efficient over time. Key metrics:
- Cost per feature point (trending down = good)
- Revenue per engineering dollar (trending up = good)
- Lead time for revenue-critical features (trending down = good)
Slide 4: Forward-Looking Investment Case
End with what the next quarter's investment will produce. Tie the engineering roadmap to specific revenue opportunities.
"The Q2 roadmap targets $2.1M in ARR opportunity. Key bets: Enterprise API ($800K pipeline), Advanced Analytics ($600K pipeline), Mobile App ($700K pipeline). Required engineering investment: $1.8M."
Tracking the Metrics You Need
To calculate and present engineering ROI consistently, you need:
- Accurate time allocation data — how engineering time splits across features, maintenance, and debt
- Cost per developer — individual hourly rates, not averages
- Feature-to-revenue mapping — connecting shipped features to business outcomes
- Trend data — quarter-over-quarter improvements in efficiency
What to Track Monthly
| Metric | Formula | Target Trend |
|---|---|---|
| Cost per shipped feature | Total eng cost / Features shipped | ↓ |
| Revenue per eng dollar | Revenue enabled / Eng spend | ↑ |
| Allocation ratio | New features / Total eng time | 60-70% |
| Cost variance | Actual cost / Estimated cost | → 1.0 |
| Engineering cost ratio | Eng spend / Total revenue | ↓ as you scale |
Industry Benchmarks
For context when presenting to the board (Gartner IT Spending Forecast and Deloitte CFO Survey data provide additional framing):
| Company Stage | Eng Cost as % of Revenue | Eng Team as % of Headcount |
|---|---|---|
| Early-stage startup | 40-60% | 60-80% |
| Growth stage | 25-35% | 40-50% |
| Mature SaaS | 15-25% | 25-35% |
| Enterprise software | 10-20% | 20-30% |
If your engineering cost ratio is within range for your stage, that's a data point in your favor. If it's above range, you need the ROI data to justify the investment.
Common Mistakes When Calculating Engineering ROI
Mistake 1: Using Average Developer Cost
A team with 5 senior engineers ($160K) and 5 juniors ($80K) has an average cost of $120K. But if the seniors are doing 80% of the revenue-critical work, your cost attribution is wrong. Use individual rates.
Mistake 2: Ignoring Maintenance Value
Teams often present only new feature value, making maintenance look like wasted money. Frame it differently: "Our 25% maintenance allocation prevents an estimated $1.2M in annual churn by keeping the platform reliable."
Mistake 3: One-Time Value Instead of Lifetime
A feature that generates $100K in its first quarter might generate $400K+ over its lifetime. Presenting only the first-quarter value dramatically understates engineering contribution.
Mistake 4: No Comparison Baseline
ROI in isolation means little. Compare against: last quarter, last year, industry benchmarks, or the cost of not building (opportunity cost of lost deals).
How PanDev Metrics Enables ROI Tracking
Calculating engineering ROI requires data that most organizations don't have. PanDev Metrics provides the foundation:
- Automated time tracking across 10+ IDEs — know exactly how time splits between features, maintenance, and debt
- Individual hourly rates — set per-developer rates for accurate cost attribution
- Project-level financial analytics — see cost per project, per team, per developer in real time
- 4-stage Lead Time breakdown — understand not just how much features cost, but where time is spent
- On-premise deployment — financial data (salaries, rates, project costs) stays within your infrastructure
- AI assistant — generates insights and summaries ready for executive presentations
The goal isn't perfect ROI attribution. It's going from "we don't know" to "here's a defensible number backed by real data." That shift alone changes how the C-suite views engineering investment.
Key Takeaways
- Engineering ROI is calculable — use the four-category framework: revenue features, retention, efficiency, platform
- Conservative attribution is fine — a defensible 30-40% attribution beats a questionable 100%
- Show trends, not snapshots — quarter-over-quarter improvement matters more than absolute numbers
- Frame maintenance as value preservation — it's not waste; it's revenue protection
- Connect the roadmap to revenue — every engineering investment should map to a business outcome
Want to calculate your engineering team's ROI with real data? PanDev Metrics gives you automated cost tracking, financial analytics, and the data foundation to make the business case for engineering.