Engineering ROI: 5 Methods That Survive Board Review

A VP of Engineering presents a $1.2M microservices migration to the board. ROI projection: "we save 30% on infra and ship 2x faster." The CFO asks: "Show me the math." The answer is a single number, 240%, with no method behind it. The board says no. Two quarters later, a competitor closes the same migration in eight months and starts winning enterprise deals on latency. The project was good. The math was the problem.
There is no single "engineering ROI formula." There are five distinct calculation methods, each built for a different question. McKinsey's Developer Velocity Index research found top-quartile teams generate 4–5x the revenue per developer of bottom-quartile teams. That ratio means nothing without specifying how you measured it. Pick the wrong method for the question being asked and you will lose a defensible project. This article walks through all five with worked numbers.
{/* truncate */}
Why "ROI" alone is a worthless word
When a CTO writes ROI = 4.8x on a slide, the CFO mentally inserts a question: 4.8x of what, over what window, against what discount rate? If the slide doesn't answer that, the number is treated as marketing. We covered the framework basics in Engineering Team ROI: How to Calculate and Present to Business. This piece is the next layer down: the five methods and when each one wins.
The methods sort by what they're best at:
- Tooling investment? → Payback period.
- Multi-year platform bet? → NPV.
- B2B SaaS feature for enterprise customers? → ARR attribution.
- Roadmap prioritization? → Cost-per-feature ROI.
- Developer experience / pipeline upgrade? → DORA-improvement ROI.
Boards reject correctly-calculated numbers when they're presented in the wrong frame. They approve worse-but-better-framed projects. The bar isn't accuracy. The bar is defensibility.
The 5 methods at a glance
| Method | Formula | Best for | When it lies |
|---|---|---|---|
| Payback period | Investment ÷ annual savings | Tooling, CI/CD, internal devex | Ignores everything past payback; rewards short-horizon thinking |
| NPV | Σ (cash flow / (1+r)^t) − initial cost | Long-horizon platform / migration | Discount rate r is a CFO judgment call; NPV swings wildly with it |
| ARR attribution | New ARR unblocked ÷ feature cost | B2B SaaS feature for enterprise tier | Sales attribution is messy; deals close for many reasons |
| Cost-per-feature ROI | Revenue uplift ÷ cost-per-feature | Roadmap prioritization, post-launch review | Requires accurate cost-per-feature; usage→revenue link is fuzzy |
| DORA-improvement ROI | $ value of DORA delta ÷ investment | DevEx, pipeline, platform upgrades | Translating "lead time −5 days" into dollars requires a model |
Method 5 is the one most teams skip because it requires linking cost-per-feature to delivery metrics. Most engineering finance tools and DORA tools are separate products. PanDev Metrics keeps both in the same dashboard, so the link is queryable. More on that in method 5.
Method 1 — Payback period
The simplest method. Months until savings recover the original investment.
Worked example: internal CI/CD upgrade.
- Investment: $80,000 (consulting + 2 internal engineers × 6 weeks).
- Savings: 2 hours/dev/week saved on slow builds × 50 developers × loaded rate $46/hr × 50 working weeks/year = $230,000/year.
- Annual savings: $230K. Monthly: ~$19.2K.
- Payback: $80K ÷ $19.2K ≈ 4.2 months.
When this method wins: tooling decisions where the upside is "savings start immediately." Boards understand months. A 4-month payback on developer tooling rarely fails to get approved.
When it lies: a 10-year savings stream and a 9-year savings stream both look identical at month 4. Payback ignores everything past the breakeven point. Don't use it for platform migrations.
The savings calculation here depends on knowing the loaded hourly rate. We covered the math in Loaded Hourly Rate: What Each Engineer Actually Costs. Without that, your "$46/hr" is fiction.
Method 2 — NPV (Net Present Value)
For multi-year bets where cash flows over time matter and the discount rate is the swing variable.
Worked example: microservices migration.
- Investment: $1,200,000 spread over 18 months.
- Annual savings (years 2–6): $400,000/year (infra reduction + faster delivery).
- Discount rate: 12% (typical for a B2B SaaS at growth stage; CFO's call).
- Calculation:
Year 0–1.5: −$1,200K (sum of investment, simplified to year 0)
Year 2: $400K / (1.12)^2 = $319K
Year 3: $400K / (1.12)^3 = $285K
Year 4: $400K / (1.12)^4 = $254K
Year 5: $400K / (1.12)^5 = $227K
Year 6: $400K / (1.12)^6 = $203K

NPV ≈ $1,288K − $1,200K ≈ +$88K
A small positive NPV. Now run the same with r = 8% (lower discount, e.g. mature company) and NPV jumps to roughly +$240K. Same project, two different rs, two different stories. This is why CFOs argue about discount rates for hours.
When this method wins: long-horizon platform projects, anything with cash flows past 3 years. Boards expect NPV for capital-grade decisions.
When it lies: the discount rate is a judgment call dressed up as math. A 12% rate vs an 8% rate can flip the sign of the result. Always present a sensitivity table.
Method 3 — ARR attribution
For B2B SaaS feature work where the question is "did this feature unlock a deal?"
Worked example: SSO/SAML feature for enterprise tier.
- Cost to build: $100,000 (4 engineers × 6 weeks loaded).
- Outcome: 3 enterprise prospects who had SSO as a procurement requirement signed. Average ACV: $160,000.
- New ARR unblocked: $480,000.
- ROI: $480K / $100K = 4.8x.
When this method wins: feature work that gates enterprise procurement (SSO, audit logs, SOC 2 controls, on-prem deployment, RBAC). Sales can name the deals. CRM has the timestamps.
When it lies, and this is the biggest caveat in the whole article: sales attribution is messy. Did SSO close the deal, or did the relationship close it and SSO just unblocked legal? Atlassian's engineering ROI playbook notes that B2B sales attribution rarely converges on a single cause. The honest version of the slide is: "Three deals listed SSO as a procurement requirement; total ARR $480K. Without SSO, two of these deals had a >50% chance of going to a competitor based on RFP feedback." That's a defensible 4.8x. A flat 4.8x without the attribution caveat is a slide the CFO will dismantle in 30 seconds.
Method 4 — Cost-per-feature ROI
For roadmap prioritization and post-launch retrospectives. Requires that you actually know what each feature cost.
Worked example: a workflow-automation feature.
- Cost-per-feature (calculated from IDE telemetry × loaded rate × overhead K): $32,000.
- Outcome: 18% increase in active usage on the workflows module → attributable revenue uplift via expansion ARR: $145,000 in the 6 months following launch.
- ROI: $145K / $32K = 4.5x.
When this method wins: post-launch reviews ("which of last quarter's features actually paid back?") and prioritization debates ("Feature A projected 6x, Feature B projected 1.8x, start with A").
When it lies: the cost side is solid only if your cost-per-feature math is solid. We documented the SQL in Cost per Feature: The SQL Formula That Actually Works. The revenue side is fuzzier. Usage → expansion ARR is a model, not a measurement.
This is also the method most directly tied to what PanDev Metrics measures. The platform's POST /finance/top-expenses endpoint pulls per-feature cost from IDE telemetry, and the feature dashboard joins those costs to the issue-tracker tags. We covered the timing dimension in Cost of Delay: What Each Week of Slipping a Feature Actually Costs: when CoD is high, even a 1.5x feature ROI can dominate a 5x feature with low CoD.
Method 5 — DORA-improvement ROI
The most underused method, because it requires linking cost data to delivery metrics. Most teams keep these in separate tools.
Worked example: PR-pipeline upgrade.
- Investment: $250,000 (platform engineers × 3 months + tooling).
- DORA outcome: lead time for changes drops from 9 days median to 4 days. Deployment frequency rises 1.6x. Change failure rate stays flat (good; we didn't trade quality for speed).
- Translation to dollars: 5 days saved per change × ~150 changes/quarter × $46/hr loaded × ~3 hrs/change wait time = ~$103K/quarter from reclaimed wait time alone. Add the value of faster customer feedback loops (estimated by product at $50K/quarter on time-sensitive features) and the total annual upside lands at $612K/year.
- ROI: $612K / $250K = 2.48x in year 1, with the savings continuing.
When this method wins: any DevEx investment, platform-team budget defense, build/test/deploy infrastructure. The 2024 DORA State of DevOps Report repeatedly shows that elite-performing teams deliver in hours where low performers take weeks. That delta has a dollar value, and DORA-improvement ROI is the method that captures it.
When it lies: the dollar-translation step is a model. "Lead time saved → dollars" requires assumptions about what the team does with the saved time. If it goes into more meetings, the ROI is zero. We covered the metric definitions in detail in DORA Metrics: The Complete Guide for Engineering Leaders.
PanDev Metrics is, as far as we've seen, the only platform that keeps cost-per-feature in the same query plane as DORA metrics. Most engineering finance tools (cost) and DORA tools (delivery) are separate products. The integration matters for method 5 specifically: you can answer "how much did we spend on the pipeline upgrade, and how much did lead-time improvement save us per quarter?" in one dashboard, not by exporting CSVs and joining in Excel.
The 5 methods on the same hypothetical project pool
If a CTO has a $250K budget and is evaluating five candidate projects (one fitting each method), here is what the board sees:
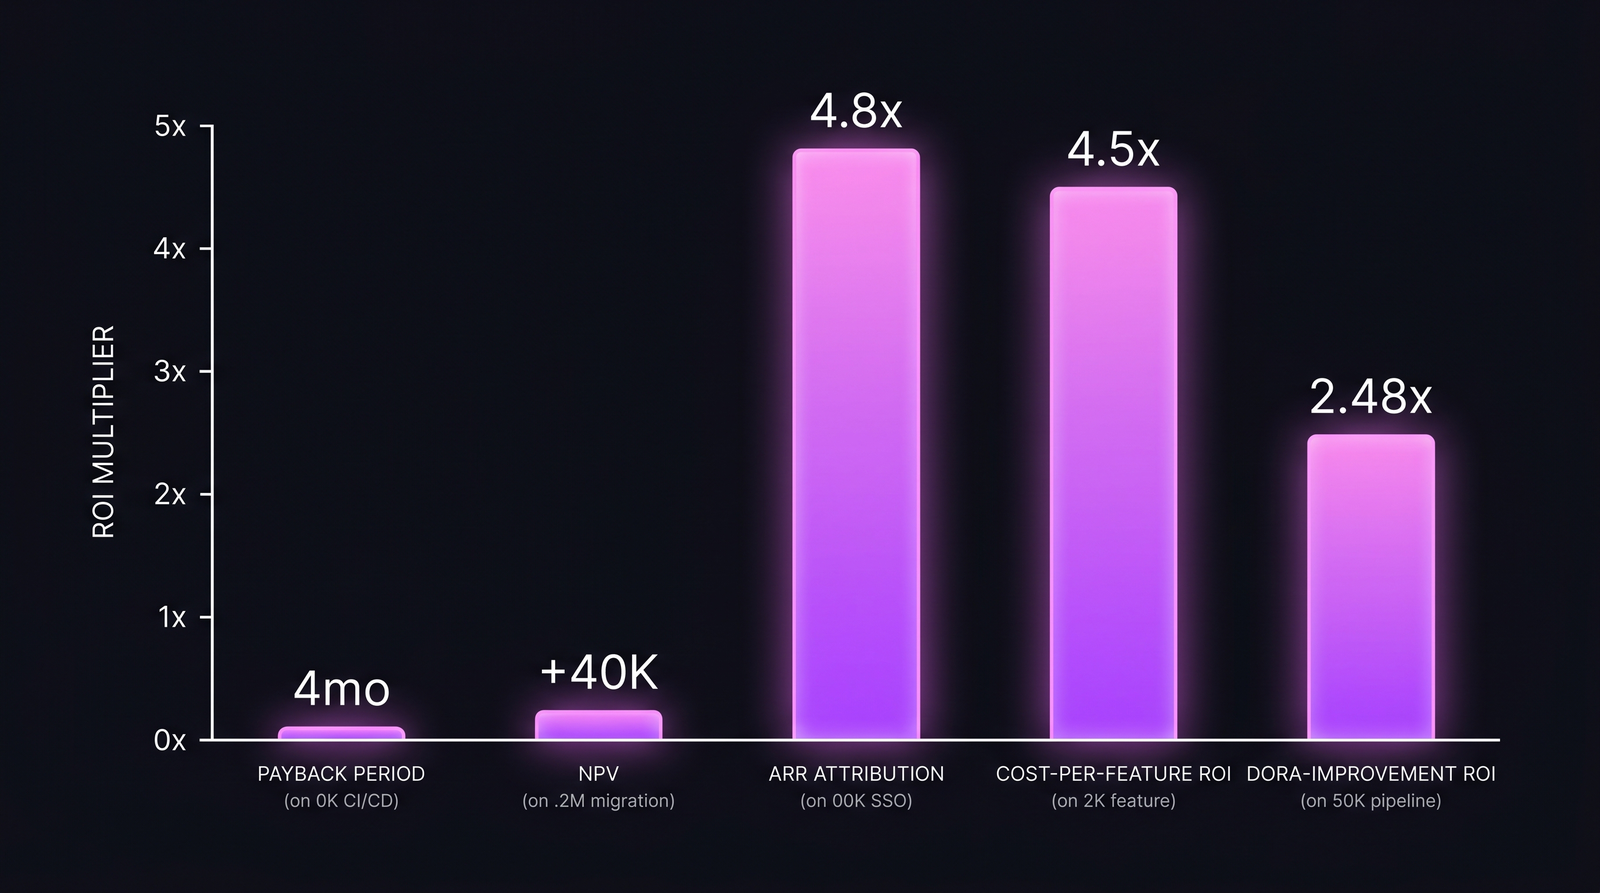 Same dollar input, five methods, five very different ROI shapes. Method choice changes the prioritization order.
| # | Project | Method | Cost | Value | ROI / payback |
|---|---|---|---|---|---|
| 1 | CI/CD upgrade | Payback period | $80K | $230K/yr | 4.2-month payback |
| 2 | Microservices migration | NPV (8% rate) | $1.2M | $400K/yr × 5 yrs | +$240K NPV |
| 3 | SSO / SAML feature | ARR attribution | $100K | $480K new ARR | 4.8x ROI |
| 4 | Workflow-automation feature | Cost-per-feature | $32K | $145K expansion | 4.5x ROI |
| 5 | PR-pipeline upgrade | DORA-improvement | $250K | $612K/yr value | 2.48x ROI year 1 |
Notice that the lowest-ROI number on the table (NPV $240K on a $1.2M project ≈ 1.2x) is also the largest absolute dollar value. Boards optimizing for ratio kill the migration. Boards optimizing for absolute value approve it. This is why method choice matters.
Common mistakes that lose board approval
1. Presenting one number as "the" ROI. A single number invites attack. Two methods on the same project (e.g. payback and NPV for a tooling decision) triangulate and neutralize the "what about your discount rate?" objection.
2. Hiding the discount rate. For NPV, always show the sensitivity table at 8%, 12%, 15%. The CFO will run those numbers anyway. Beat them to it.
3. Using ARR attribution without sales sign-off. If the head of sales hasn't agreed that feature X gated those three deals, the number is fiction. Get the email confirmation before the slide hits the deck.
4. Skipping the time component. A 5x ROI realized over 5 years is not the same as a 5x ROI realized in 6 months. Always state the window.
5. Ignoring the "do nothing" baseline. Every ROI calculation has an implicit comparison: ROI vs what? Sometimes the alternative is "do nothing" (in which case state it). Sometimes it's "the next-best project" (in which case show the comparison). Boards punish unstated baselines.
The honest limit
All five methods require defensible inputs. ARR attribution is especially shaky: sales attribution is genuinely messy and the 4.8x in the example above is an upper bound, not a measurement. NPV's discount rate is a judgment call. Payback ignores everything past the breakeven point. Cost-per-feature ROI's revenue side is a model, not a measurement. DORA-improvement ROI's dollar-translation step is a model on top of a model.
None of these are "objective." Use two methods on the same project and triangulate. Never present one number as if it were the ROI. The CTOs we've seen lose board approvals weren't wrong about the project; they were over-precise about the math. A bracket ("4.2x to 5.5x depending on attribution model") survives scrutiny that "4.8x" doesn't.
What to do this quarter
Pick the next budget request you have to defend. Run two methods on it. If both methods agree the project is worth doing, you have a defensible slide. If they disagree, you've found the assumption that's actually load-bearing, and that's the conversation the board wants to have anyway.
If you're a CTO inheriting a quarterly budget defense without per-feature cost data, start there. Without cost-per-feature, methods 4 and 5 are unreachable, and you're stuck with the three weakest options. The CFO's Guide to Engineering Metrics walks through how to get the finance side talking to the delivery side. That's the prerequisite for any of this math working.