The Perfect Client Report in One Click: What Should Be Inside

The Deloitte Global Outsourcing Survey found that reporting quality is a top factor in outsourcing client satisfaction — yet most clients don't read past the first page. Your client skims the executive summary, glances at the total hours, checks the cost, and closes the file. Yet you spend 2-3 hours every month crafting that report. Something doesn't add up.
The perfect client report isn't the longest or the most detailed. It's the one that answers all the client's questions in 60 seconds — and takes you 60 seconds to generate.
{/* truncate */}
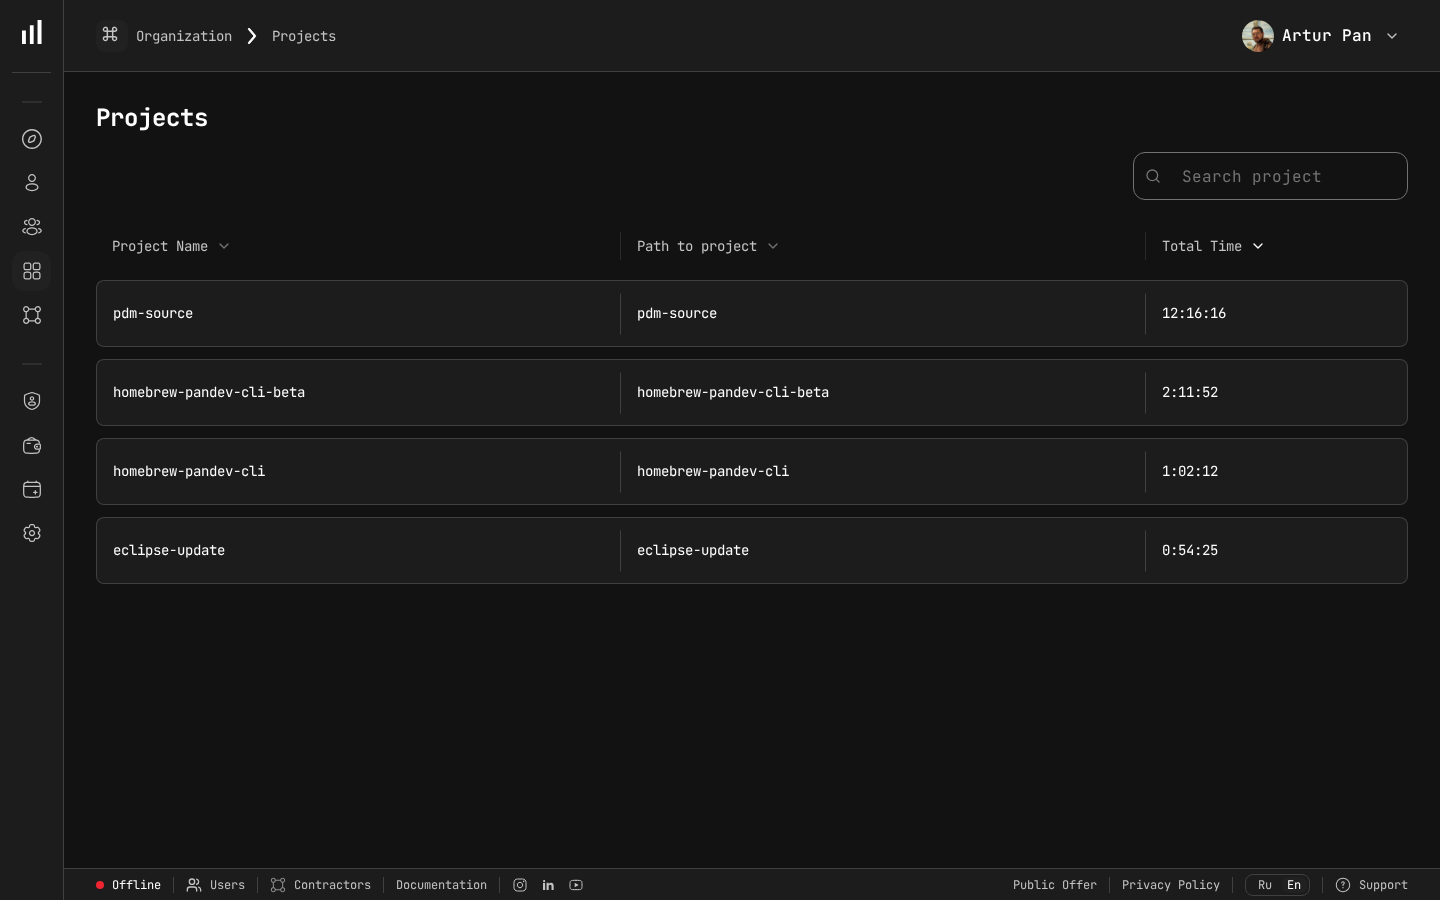
Project data that populates one-click Excel reports.
Why Client Reports Matter More Than You Think
Before we talk about what goes into a report, let's talk about why it matters.
A client report in outsourcing isn't just a summary of work done. It serves four critical business functions:
1. Invoice Justification
The report is attached to the invoice. It says: "Here's what you're paying for." Without it, the invoice is an opaque request for money. With it, the invoice becomes a transparent exchange of value.
2. Trust Maintenance
Between monthly meetings, the report is your primary trust signal. A clear, data-backed report says: "We're professional, organized, and have nothing to hide." A vague, narrative-only report says: "Just trust us."
3. Stakeholder Communication
Your client contact isn't the only person who sees the report. It gets forwarded to their finance team, their CTO, sometimes their CEO. The report needs to work for all audiences — technical and non-technical alike.
4. Dispute Prevention
Most billing disputes start with vague reporting. IAOP data consistently shows that disputes decrease sharply when reporting transitions from narrative ("the team worked on features") to quantitative ("the team logged 642.5 hours across 4 developers, with 68% on backend development and 32% on frontend"). Specific numbers are much harder to argue with.
What Clients Actually Want to See
We've collected feedback from dozens of outsourcing clients about what they look for in reports. Here's the hierarchy of needs:
Must-Have (clients will ask if missing)
- Total hours per developer — How much did each person work?
- Total cost — What's the bottom line?
- Date range — What period does this cover?
- Project/service breakdown — Where did the hours go?
Should-Have (increases satisfaction)
- Daily activity chart — Visual proof that work happened consistently
- Comparison to previous period — Are things trending up or down?
- Cost per developer — Breakdown of who costs what
- Budget utilization — Percentage of monthly budget consumed
Nice-to-Have (impresses but not expected)
- Technology breakdown — Languages and frameworks used
- Activity patterns — Peak productivity times
- Key deliverables list — What was actually shipped
- Recommendations — Data-backed suggestions for next period
The Report Template
Here's the template that covers all client needs in a clean, scannable format. This is what PanDev Metrics generates as an Excel export with one click.
Section 1: Executive Summary (One Screen)
This is the section 90% of readers will see. Make it count.
Report Period: March 1 – March 31, 2026
Client: TechCorp Inc.
Project: E-Commerce Platform v3

Total Hours:    642.5
Total Cost:     $44,975
Developers:     4 active
Budget Used:    89% of $50,000 monthly allocation
Status:         ✓ On Track
Six lines. The client's CFO gets what they need without scrolling.
Section 2: Developer Breakdown
| Developer | Role | Hours | Rate | Cost |
|---|---|---|---|---|
| Alex K. | Senior Backend | 168.0 | $75 | $12,600 |
| Maria S. | Frontend | 162.5 | $65 | $10,562 |
| James T. | Full-stack | 158.0 | $70 | $11,060 |
| Olga P. | QA Engineer | 154.0 | $55 | $8,470 |
| Total | 642.5 | $42,692 |
Note: costs don't include project management overhead in this example. Adjust based on your billing model.
This table answers the most common client question: "What am I paying each person?" It also helps the client understand the cost structure — if they want to reduce the budget, they can see where the biggest line items are.
Section 3: Daily Activity Chart
A visual chart showing hours per day across the reporting period. This is enormously effective because it provides at-a-glance proof of consistent work.
What the client sees:
- Work happened every business day (no unexplained gaps)
- Weekends show minimal or zero activity (the team isn't artificially inflating hours)
- There's natural variation (real data, not fabricated round numbers)
In Excel, this renders as a simple bar chart with date on the X-axis and hours on the Y-axis. PanDev Metrics includes this chart automatically in the export.
Section 4: Project/Service Breakdown
If the team works on multiple services or modules within the same project:
| Service/Module | Hours | % of Total | Cost |
|---|---|---|---|
| Backend API | 245.0 | 38% | $17,150 |
| Frontend (React) | 178.5 | 28% | $11,603 |
| Database & Migrations | 87.0 | 14% | $6,090 |
| Testing & QA | 98.0 | 15% | $5,390 |
| DevOps/CI | 34.0 | 5% | $2,380 |
| Total | 642.5 | 100% | $42,613 |
This breakdown prevents the "where did all the hours go?" question. It also surfaces insights — if 14% of hours went to database migrations, the client understands why feature delivery might have seemed slower.
Section 5: Period Comparison
| Metric | February | March | Change |
|---|---|---|---|
| Total Hours | 612.0 | 642.5 | +5.0% |
| Total Cost | $42,840 | $44,975 | +5.0% |
| Avg Hours/Developer/Day | 6.8 | 7.2 | +5.9% |
| Developers Active | 4 | 4 | — |
Trend data builds long-term confidence. If the client sees consistent, steady output month after month, they stop worrying.
Section 6: Notes and Recommendations (Optional)
This is the only narrative section. Keep it brief:
Notes:
- Sprint velocity increased due to completion of the authentication
  refactoring in week 1
- Database migration effort (87 hours) was a one-time investment;
  expect this to drop to ~10 hours/month going forward
- Recommend adding a part-time DevOps resource in Q2 as deployment
  frequency increases
This section transforms the report from a timesheet into a strategic document. The client sees that you're not just billing hours — you're thinking about their project's future.
What NOT to Include
Knowing what to leave out is as important as knowing what to include.
Don't include: Individual file-level detail
"Edited auth.controller.ts for 2.3 hours" is too granular. Clients don't care about files — they care about features and services.
Don't include: Minute-by-minute logs
A 40-page printout of timestamps doesn't demonstrate transparency — it demonstrates that you haven't synthesized the data. Give summaries, not raw logs.
Don't include: Jira ticket numbers without context
"PROJ-2847: 14 hours" means nothing to a non-technical stakeholder. Either map tickets to feature names or skip the ticket-level detail.
Don't include: Internal metrics
Developer velocity scores, individual performance rankings, or internal team communications don't belong in client reports. The report is about what the client is paying for, not how you manage your internal team.
Don't include: Vanity metrics
"1,247 Git commits this month" sounds impressive but means nothing. Commits can be tiny or massive. Lines of code written is equally meaningless. Stick to hours, cost, and deliverables.
The One-Click Generation Process
Here's how the report generation actually works in practice with PanDev Metrics:
Before (Manual Process)
- PM asks each developer for their hours (30 min of chasing)
- PM opens spreadsheet template (5 min)
- PM enters hours, calculates costs, builds charts (60-90 min)
- PM writes narrative summary (30 min)
- PM formats and reviews (20 min)
- PM sends to client (5 min)
Total: 2.5 – 3 hours per client per month
For 5 clients: 12-15 hours per month on reporting alone.
After (Automated Process)
- PM opens PanDev Metrics, selects client and date range (30 sec)
- PM clicks "Export to Excel" (10 sec)
- PM reviews the auto-generated report (5 min)
- PM adds optional narrative notes (5 min)
- PM sends to client (1 min)
Total: ~12 minutes per client per month
For 5 clients: 1 hour per month on reporting.
That's a 12x reduction in reporting time. The PM gets 10+ hours per month back for actual project management.
Report Delivery Best Practices
How you deliver the report matters almost as much as what's in it.
Attach it to the invoice
Don't send the report separately from the invoice. The psychological effect of receiving an invoice with an attached activity report is powerful — it says "this invoice is backed by data."
Send it consistently
Same day every month. If you invoice on the 1st, send the report on the 1st. Consistency builds trust. Inconsistency creates anxiety ("why is the report late this month?").
Include a one-line summary in the email
Don't make the client open the attachment to get the headline. Put it in the email body:
"Attached: March activity report. Your team logged 642.5 hours ($44,975) across 4 developers. Full breakdown in the attached Excel file."
Offer a call to walk through it
Once a quarter, offer a 15-minute call to walk through the report together. Most clients will decline — but the offer itself signals transparency and confidence.
Make the format non-editable
Send as PDF for the visual report and Excel for the data. The Excel allows clients to run their own analysis (some finance teams want this). The PDF prevents accidental modifications.
Adapting for Different Client Types
Not all clients need the same report:
The Hands-Off CEO
Wants: Executive summary only. Total hours, total cost, status indicator.
Strategy: Lead with the one-screen summary. Include detail pages for their CTO to review if needed, but don't expect the CEO to go past page one.
The Detail-Oriented CTO
Wants: Everything. Developer breakdown, technology split, daily patterns, service-level hours.
Strategy: Give them the full report. Consider offering dashboard access so they can explore on their own.
The Finance-First CFO
Wants: Numbers that tie to the contract and budget. Cost breakdown, budget utilization, comparison to contracted rates.
Strategy: Emphasize the cost sections. Include a row showing "contracted hours vs. actual hours" and "contracted cost vs. actual cost."
The Metrics-Savvy VP of Engineering
Wants: Trends, patterns, efficiency indicators. Week-over-week comparisons, utilization rates, technology breakdown.
Strategy: Add the comparison section and any trend data you have. This stakeholder appreciates context and recommendations.
Building Long-Term Reporting Value
Individual monthly reports are useful. A year of monthly reports is strategic.
After 6-12 months of consistent reporting, you can offer the client:
- Annual review: Total hours, total cost, cost per feature area, team growth over time
- Efficiency analysis: How the team's velocity changed as they gained domain knowledge
- Forecasting: Based on 12 months of data, project next quarter's resource needs
- Benchmarking: How this project compares to similar projects (with anonymized data)
This transforms reporting from an administrative task into a strategic service — and gives you a powerful reason for contract renewals.
Key Takeaways
- Client reports serve four functions: invoice justification, trust maintenance, stakeholder communication, and dispute prevention
- The must-have elements are: total hours, total cost, date range, and project breakdown
- A daily activity chart is the single most effective visual — it proves consistency at a glance
- Leave out raw logs, file-level detail, and internal metrics — they create noise, not clarity
- One-click report generation reduces reporting time from 3 hours to 12 minutes per client
- Deliver reports attached to invoices, on a consistent schedule, with a one-line email summary
- After 12 months of consistent reporting, you gain strategic value through trends and forecasting
Generate client reports in one click. PanDev Metrics automatically tracks developer activity, calculates costs, and exports client-ready Excel reports — so you spend minutes on reporting, not hours.