Figma to Code: Design Handoff Metrics That Matter

A fintech product team we work with shipped a single 400-line feature four times. The Figma file updated Tuesday. Dev started Wednesday. Design reopened the file Thursday morning to "refine spacing" and again Friday afternoon for "one more micro-interaction." The feature shipped on Monday. The engineer then spent two days fixing visual regressions caught by the PM post-ship. Total time: 7 engineering days. Total net-new code: 400 lines. The handoff killed more than the work.
The "Figma-to-code" conversation is usually about tools — Zeplin, Figma Dev Mode, Locofy, Visual Copilot. None of those fix the actual problem, which is that the design-to-code handoff is a measurement gap hiding in a process gap. We'll define the metrics that actually predict a good handoff, how to measure them without adding overhead, and where the tool choice matters (sometimes) vs doesn't (usually).
{/* truncate */}
The problem: design and engineering measure different things
Design teams measure completion ("the spec is done"). Engineering teams measure throughput ("the feature is shipped"). Nobody measures the handoff itself — the moment between design "done" and engineering "deployed" — which is where cost hides.
UC Irvine's Gloria Mark work on task-switching applies here in a specific way: every time a Figma spec changes after a developer has started implementation, that developer pays a 23-minute refocus tax on the next working session. Multiply by three change cycles and the feature's lead time doubles. Figma's own 2024 user report noted the average design spec gets 4.3 edits after dev implementation begins — not the same as 4.3 revision cycles, because most are minor, but enough to force a rebuild/re-review pair in at least one iteration.
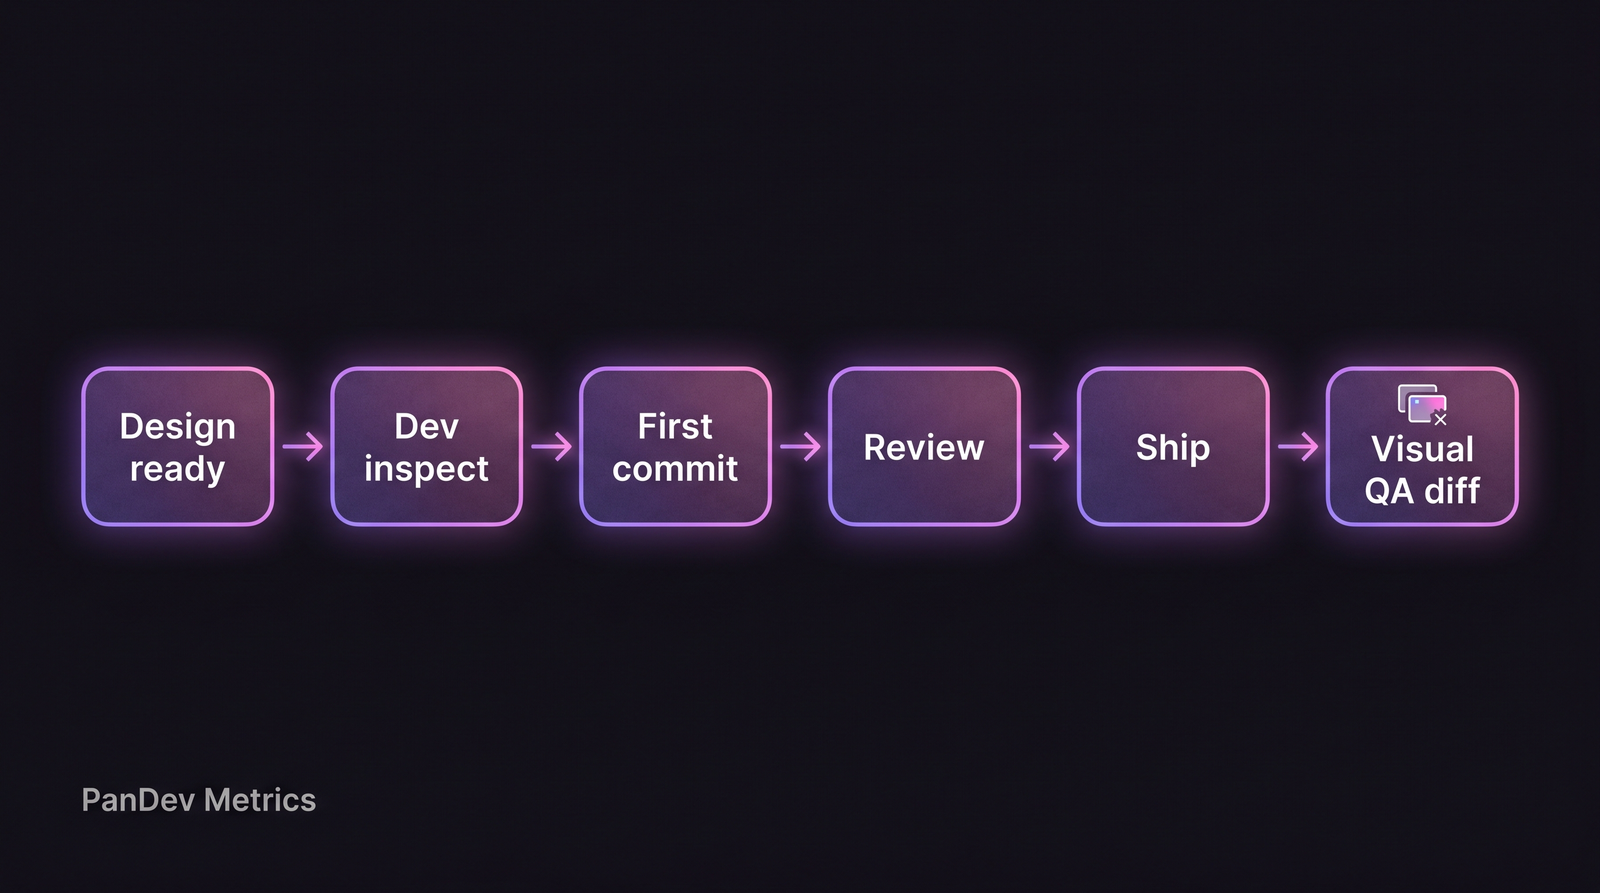 The six-stage handoff — only two of these are "coding." The other four are where teams either coordinate or burn time.
The 5 handoff metrics that matter
Rank ordered by how much they predict shipped-feature quality and speed:
1. Spec stability rate (SSR)
Definition: Percentage of design specs that do not get edited between dev-start and dev-complete.
Why it matters: The single biggest signal of handoff health. When SSR is high, engineering runs to spec. When SSR is low, engineering runs in circles.
| SSR | What it means |
|---|---|
| >85% | Healthy. Design is locking before handoff. |
| 60-85% | Normal for growth-stage teams with fast product iteration. |
| <60% | Design is still negotiating in the dev's backlog. Hard-stop problem. |
Measure by exporting Figma file version history against the dev-start timestamp. If you have Figma enterprise, this is an API call. If not, it's a manual sample (20 features, tag dev-start and dev-complete, count intervening edits).
2. Visual diff rework
Definition: Number of "visual polish" commits after the first shipped version, divided by total feature commits.
Why it matters: Captures the rework caused by spec ambiguity, not genuine feature iteration. A 12-commit feature with 2 "visual polish" commits is normal. With 6 polish commits, the spec was underspecified.
| Visual diff rework ratio | Interpretation |
|---|---|
| <15% | Spec was clear, pixel work minimal |
| 15-30% | Some design-dev back and forth |
| >30% | Either spec was vague or design-dev communication broke down |
3. Inspect-to-first-commit time (IFT)
Definition: Median elapsed time between a developer opening the Figma file in Dev Mode and their first commit on the feature branch.
Why it matters: Proxy for spec comprehension cost. If devs take 4+ hours from inspect to first commit, the spec isn't inspect-ready — tokens missing, component names inconsistent, states undefined.
Target: <90 minutes for medium-complexity features. Over 3 hours is a process smell.
4. Component adoption rate
Definition: Of the UI in a shipped feature, what percentage is built from the design-system component library vs bespoke code.
Why it matters: High adoption = the design system is working; low adoption = either the library is incomplete or devs don't know it exists. Both problems are fixable but need to be known.
Most mature teams target >70% adoption. Teams without a design system (or with a stale one) often show <30% component adoption.
5. Design-origin defect rate
Definition: Of bugs filed in the first 30 days post-ship, what fraction trace to design ambiguity rather than code defects.
Why it matters: Design-origin defects are the expensive ones — they require design re-spec AND dev rework, often with PM escalation. A team above 20% design-origin defects is not getting value from its design process.
How to measure these without adding overhead
Three options, increasing sophistication:
Option A — Calendar audit (2 weeks, no tooling). Pick 10 shipped features. For each, look at:
- Figma file "last edited" timestamp vs PR open timestamp
- Visual polish commits on the PR
- Dev Mode open time from the Figma Activity log (if available)
Log to a spreadsheet. Compute the five metrics. This is enough to calibrate.
Option B — CI hook (1-sprint setup). Tag commits with [design], [feature], [polish]. A simple CI parser computes visual diff rework ratio per feature automatically.
Option C — Full telemetry (ongoing). Connect Figma file metadata to Git events. Most teams over-engineer this. Option B hits 80% of the value.
The 6-step handoff framework
Step 1 — Design locks before dev starts
The "locked" state is an explicit Figma branch tag, not a Slack message. A new branch called {feature}-v2 opens for any post-lock change. Engineering works off the locked branch, not the main file.
Step 2 — Spec includes the states the design system forgot
Loading, empty, error, skeleton, keyboard focus, reduced-motion, RTL, long-string overflow. Figma's own 2024 Design Systems Report found 71% of design systems are missing at least 3 of these states documented — forcing developers to invent them inline.
Step 3 — Developer inspects before spec is final
Paradox: include engineering in design review BEFORE the spec locks. A 20-minute feasibility check catches 80% of the "this animation doesn't work on Android" conversations that otherwise happen in code review.
Step 4 — First commit within 90 minutes of inspect
If you can't start coding within 90 minutes, the spec isn't complete. Go back to design. This rule sounds harsh; in practice it surfaces missing-state issues immediately, not three days in.
Step 5 — Visual diff review with design, not just engineering
Before merging, design reviews the PR preview against the Figma spec. This is the moment to catch visual diff issues, not post-ship. Chromatic, Percy, and Figma Dev Mode comparisons help; the meeting matters more than the tool.
Step 6 — Post-ship defect retrospective tagged by origin
Every bug in the first 30 days gets tagged as design-origin, code-origin, or product-origin. This feeds metric 5 above and gives you data for the next retrospective.
Where tooling actually helps vs doesn't
Tools handle step 4 (inspect) and step 5 (visual diff) well. Tools do not fix steps 1, 2, 3, or 6 — those are process decisions. Buying Figma Dev Mode without enforcing a lock protocol (step 1) is spending $15/user/month on a symptom.
Here's our read on the 2026 tooling landscape:
| Tool | Solves | Doesn't solve |
|---|---|---|
| Figma Dev Mode | Inspect fidelity, token extraction | Spec stability |
| Zeplin | Inspect + asset export | Spec stability |
| Locofy / Visual Copilot / Builder.io | Generated first draft of code | Component-system alignment |
| Chromatic / Percy | Visual regression in CI | Upstream design change |
| Storybook | Component catalog, dev visibility | Adoption by product teams |
Contrarian claim: no tool makes a team with bad process good. Every tool makes a team with good process faster. If your SSR is 45%, a Figma Dev Mode rollout will not fix it.
How PanDev Metrics fits the handoff story
Two narrow but useful applications:
Time-to-first-commit measurement. We see IDE-opens on repo branches — we can detect the moment a dev starts working on a feature branch, independent of self-report. Tie that to the Figma "inspect" event (Figma enterprise exports this), and IFT (Metric 3) becomes a dashboard, not a spreadsheet exercise.
Visual polish commit classification. Our Git integration categorizes commits; a simple rule ("commits after first deploy, touching only CSS/styles/design-token files") extracts the visual diff rework ratio automatically. You don't need perfect classification — directionally correct is sufficient.
Teams that measure these show ~40% reduction in mean feature lead time over 6 months, not because they sped up coding but because they reduced rework. This aligns with our context switching research — the 40% lead-time recovery comes from eliminating switches, not from typing faster. For related reading on the measurement side, see our lead time breakdown.
The honest limit
Our dataset sees the engineering side of the handoff clearly — IDE telemetry, Git events, PR lifecycle. We don't have first-party telemetry inside Figma; spec-stability rate requires a Figma API integration that most customers haven't set up. The numbers we cite on spec edits come from Figma's public user research, not ours. If you're serious about tracking this, combine our engineering-side view with the Figma data — individually, either is partial.
Also: design-origin defect classification is subjective. Two PMs will disagree on whether a rounded-corner inconsistency is design-origin or code-origin. Track it, but don't build a scoreboard.
The sharpest claim
The handoff between design and engineering is not a tooling problem; it's a contract problem. Teams that define what "design done" means — explicitly, with a state checklist and a lock mechanism — outperform teams with better tools and vague process. The companies with the shortest feature lead times aren't using the fanciest Figma plugin. They're using a 6-item checklist that hasn't changed in two years.
Related reading
- Context Switching Kills Productivity — why spec changes are the hidden tax
- Lead Time: The 4-Stage Breakdown — how handoff time fits the DORA lead-time model
- Code Review Checklist 2026 — the review step where visual diff catches issues
- External: Figma 2024 Design Systems Report — adoption and state-coverage benchmarks
- External: Gloria Mark, Attention Span (2023) — 23-minute refocus foundation