GameDev: How to Detect and Prevent Crunch Using Data

Crunch is the game industry's open secret. Despite decades of discussion, studio closures, and developer burnout, most studios still can't answer a basic question: is our team crunching right now?
They find out when people start quitting. By then, the damage is done — to the team, the project, and the studio's reputation. The IGDA Developer Satisfaction Survey consistently reports that ~50-60% of game developers experience crunch, with many working 50+ hour weeks during peak periods.
Engineering metrics make crunch visible before it becomes a crisis. Here's how.
{/* truncate */}
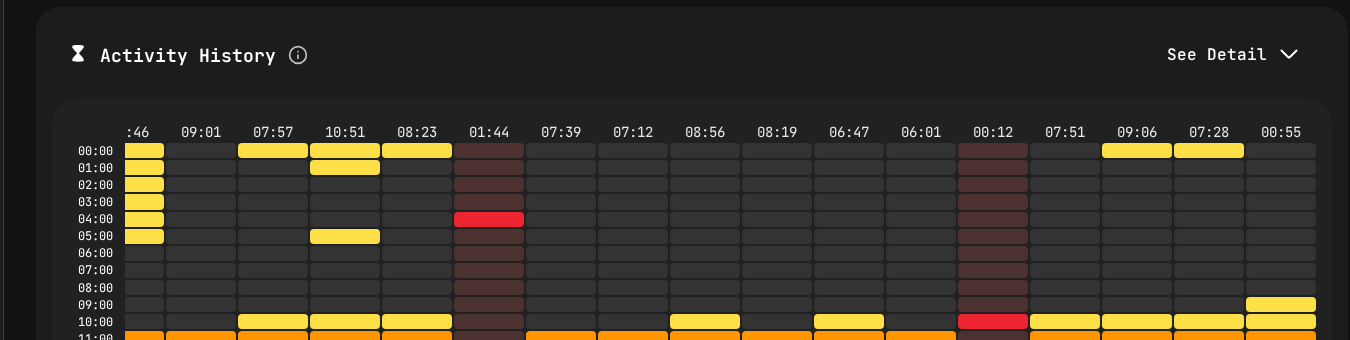
Activity heatmap revealing overtime patterns — late-night and weekend coding blocks signal crunch.
Why Crunch Is Still a Problem in 2026
The game industry has talked about crunch for 20 years. Major studios have publicly committed to eliminating it. Jason Schreier's reporting for Bloomberg and his book Press Reset documented the human cost across dozens of studios. So why does it persist?
It's invisible to leadership. When a producer asks "is the team crunching?", the answer is almost always "it's fine" — until it isn't. Nobody wants to be the person who raises the alarm, especially if overtime is seen as dedication.
It's gradual. Crunch doesn't start with 80-hour weeks. It starts with an extra hour here, a weekend push there. By the time it's obviously excessive, the pattern has been established for months.
It's disguised as engagement. A developer working late on a feature they're passionate about looks identical to a developer working late because the deadline is impossible. From the outside, both appear "committed."
There are no objective measurements. Without data, the difference between healthy dedication and unsustainable overwork is a judgment call. And that judgment call is influenced by the pressure to ship.
The Data That Reveals Crunch
IDE Activity Patterns
PanDev Metrics' IDE heartbeat tracking captures when developers are actively working in their development environment. This data reveals patterns that humans miss:
Normal pattern: Activity concentrated in an 8-9 hour window with a lunch break. Weekends show minimal or no activity.
Early crunch pattern: The activity window stretches to 10-11 hours. Weekend activity appears occasionally. This is the warning stage — intervention here is easy and effective.
Active crunch pattern: Activity spans 12+ hours regularly. Weekends show consistent multi-hour sessions. Late night activity (after 10 PM) becomes common. This is already damaging.
Burnout pattern: After weeks of active crunch, you'll see a paradoxical drop in activity. Developers are at their desks longer but producing less. Focus Time drops while total Activity Time stays high or increases. This is the crisis stage.
The key insight: you don't need to monitor individuals (and you shouldn't). Aggregate team-level patterns tell you everything you need to know.
Focus Time vs. Activity Time Divergence
PanDev Metrics tracks both Activity Time (any IDE interaction) and Focus Time (sustained, uninterrupted coding blocks). The relationship between these two metrics tells a powerful story:
Healthy state: Focus Time is roughly 50-70% of Activity Time. Developers are spending most of their coding time in productive, uninterrupted blocks.
Stress indicator: Focus Time drops below 40% of Activity Time. Developers are in the IDE more but getting less done. This signals context-switching, interruptions, or fatigue.
Crunch indicator: Activity Time increases while Focus Time stays flat or drops. The team is working longer hours but not producing proportionally more output. This is the classic crunch trap — more hours, not more results.
After-Hours and Weekend Activity
Track the percentage of IDE activity that occurs outside normal working hours (whatever your studio defines as normal):
- Baseline (healthy): 5-10% of activity outside working hours
- Warning zone: 15-25% of activity outside working hours
- Crunch zone: 25%+ of activity outside working hours
More importantly, track the trend. A sudden increase from 8% to 20% over two weeks is a clear signal that something changed — likely a deadline squeeze or scope increase.
Commit Patterns
Git activity data adds another dimension:
- Late-night commits increasing week over week
- Weekend commit frequency above baseline
- Commit message quality degrading (shorter messages, less descriptive — a subtle but real indicator of fatigue)
- Larger, less frequent commits replacing smaller, more frequent ones (developers are staying heads-down for longer stretches to avoid losing context, a sign of feeling behind)
Building an Early Warning System
Step 1: Define Your Baseline
Every studio is different. A small indie team with flexible hours will have different patterns than a AAA studio with fixed office hours. Don't apply generic standards — measure your own team's normal.
Deploy PanDev Metrics IDE plugins across your development team (supports 10+ IDEs including Visual Studio, Rider, VS Code, and JetBrains tools — all common in game development). Collect 4-6 weeks of data during a non-crunch period to establish your baseline.
Key baseline metrics:
- Average daily Activity Time per team
- Average daily Focus Time per team
- After-hours activity percentage
- Weekend activity percentage
- Deployment/build frequency
Step 2: Set Threshold Alerts
Based on your baseline, define three levels:
Green (Normal): Metrics within one standard deviation of baseline. No action needed.
Yellow (Warning): Metrics 1-2 standard deviations above baseline. Trigger a conversation with team leads about workload and deadlines.
Red (Alert): Metrics more than 2 standard deviations above baseline, or after-hours activity exceeding your defined threshold for more than one week. Trigger immediate intervention — scope review, deadline adjustment, or resource reallocation.
Step 3: Weekly Monitoring Cadence
Producers and engineering managers should review crunch indicators weekly:
- Team-level Activity Time trends
- Focus Time vs. Activity Time ratio
- After-hours and weekend activity percentages
- Deployment frequency trends (declining frequency during high activity is a bad sign)
- DORA metrics trends (rising change failure rate during high activity means quality is suffering)
Step 4: Intervention Protocols
When metrics hit warning levels:
- Talk to the team. Not accusatorially — inquisitively. "We're seeing longer hours across the team. What's driving that?"
- Review scope. Is the current milestone achievable without sustained overtime? If not, cut scope now rather than burning out the team.
- Check dependencies. Often, crunch on one team is caused by delays on another team. Address the root cause, not the symptom.
- Adjust the plan. Move deadlines, add resources, or reduce scope. These are the only three options. "Work harder" is not a plan.
The Production Pipeline View
Game development has a unique production pipeline that makes crunch particularly insidious:
Pre-Production
During pre-production, crunch risk is lower but not zero. Watch for:
- Technical directors or lead engineers putting in excessive hours on prototype work
- Unrealistic technical scope being committed to without data on actual team capacity
Engineering metrics during pre-production establish the team's actual velocity, which makes production planning more realistic.
Production
This is where crunch risk is highest. Key patterns to watch:
- Milestone crunch: Activity spikes before milestone deadlines, then drops after. This is common and may be manageable if brief, but becomes destructive if every milestone triggers it.
- Escalating baseline: Average working hours gradually increase over months. Each milestone starts from a higher baseline. This is the boiling frog pattern.
- Bug-fixing crunch: As the project matures, the bug backlog grows faster than the team can address it. Developers split time between features and bugs, leading to longer hours to keep up.
Track DORA metrics during production:
- Deployment frequency (build frequency in gamedev terms) should be stable or increasing
- Change failure rate should not spike as the team works faster
- Lead time should not creep up as more features compete for testing resources
Alpha/Beta
Feature-complete doesn't mean work-complete. Polish, optimization, and bug fixing during alpha/beta can be as crunch-intensive as production if not managed.
Watch for:
- Sudden increase in after-hours activity as the team pushes for quality
- Focus Time dropping as developers context-switch between bug fixes
- MTTR increasing as the codebase becomes more complex
Gold/Release
The final push to release is the most common crunch period. Metrics should show:
- Activity Time returning to baseline (not spiking further)
- Focus Time maintained (quality of work, not just quantity)
- Change failure rate declining (stability improving, not degrading)
If metrics show the opposite, the release date may need to move.
Using Metrics to Prevent Crunch (Not Just Detect It)
Detection is only half the value. Metrics also enable prevention:
Capacity-Based Planning
If your team averages 5 hours of Activity Time per day (a healthy, sustainable number), and your builds take 200 developer-hours per milestone, you need the team for 40 developer-days.
Don't plan for 8 hours of productive work per day. Use your actual, measured Activity Time as the basis for planning. This single change eliminates the most common source of crunch: unrealistic plans.
Scope Negotiation With Data
When a producer asks for more features, you can show the data: "Our team's sustainable capacity is X. The current scope already fills that capacity through the milestone. Adding features either means cutting something else or extending the timeline."
This is far more effective than subjective arguments about workload.
Technical Debt Budgeting
Track what percentage of team activity goes to maintenance, bug fixes, and technical debt versus new feature development. If this ratio is shifting toward maintenance, the team's effective capacity for new work is declining.
Address technical debt proactively rather than letting it accumulate until the team can't move fast enough, triggering crunch to compensate.
Team Health Dashboards
Make crunch indicators visible to the entire leadership team, not just engineering management:
- Activity Time trends
- After-hours activity percentages
- Focus Time ratios
- Deployment frequency and change failure rate
When everyone can see the data, the conversation shifts from "can we add this feature?" to "can we add this feature sustainably?"
The Business Case Against Crunch
For studios where leadership needs convincing, engineering metrics provide the business case:
Crunch doesn't increase output proportionally. Research and production data consistently show that after 2-3 weeks of extended hours, Focus Time (productive output) declines even as Activity Time (hours in the IDE) increases. This aligns with findings from the IGDA's Quality of Life surveys — studios that enforced sustainable hours reported comparable or better output over a full production cycle than studios that relied on crunch.
Quality degrades under crunch. Track change failure rate during crunch periods versus normal periods. The data will show that quality drops, which means more bug-fixing work later — a vicious cycle.
Attrition is expensive. A developer who quits due to burnout costs ~$50K-$150K in recruitment, onboarding, and lost institutional knowledge. The IGDA Developer Satisfaction Survey reports that ~50% of developers who leave the industry cite crunch as a primary reason. Engineering metrics can help you retain your team by preventing the conditions that drive them away.
Sustainable velocity is higher. Teams that maintain healthy work patterns consistently outperform teams that cycle between crunch and recovery when measured over quarters and years.
Privacy and Trust Considerations
This is the most important section. Crunch detection metrics will backfire if the team perceives them as surveillance.
Do:
- Use team-level aggregates, not individual data, for crunch monitoring
- Be transparent about what's being measured and why
- Frame metrics as protection for the team ("we're tracking this to prevent crunch")
- Let developers see their own data
- Use metrics to argue for the team (scope reduction, deadline extension)
Don't:
- Use individual activity data for performance reviews
- Share individual-level crunch data with producers or leadership
- Frame high activity as positive ("look how committed the team is!")
- Punish teams for low Activity Time during healthy periods
PanDev Metrics supports multi-tenancy and role-based access, so you can ensure the right people see the right level of detail.
Getting Started
- Deploy PanDev Metrics IDE plugins to your development team
- Connect your Git platform (GitLab, GitHub, Bitbucket, Azure DevOps)
- Collect 4-6 weeks of baseline data
- Define your green/yellow/red thresholds
- Establish weekly review cadence with production leads
- Create intervention protocols for each threshold level
The game industry doesn't have to accept crunch as inevitable. With the right data, you can see it coming and prevent it — protecting your team, your project, and your studio.
Ready to build a healthier game studio? PanDev Metrics — engineering intelligence that protects your team while delivering your game.