Hourly Rates and Cost Tracking: Transparent Financial Analytics for Your Team

Your engineering team has 40 developers across three offices, a mix of full-time employees and contractors, salary ranges from $60K to $190K, and contractor rates from $45/h to $150/h. Someone asks: "How much did Project X cost last month?"
You open a spreadsheet. You check Jira. You send three Slack messages. An hour later, you have a rough guess. With global IT spending projected to exceed $5 trillion in 2025, that level of imprecision is expensive at any scale.
{/* truncate */}
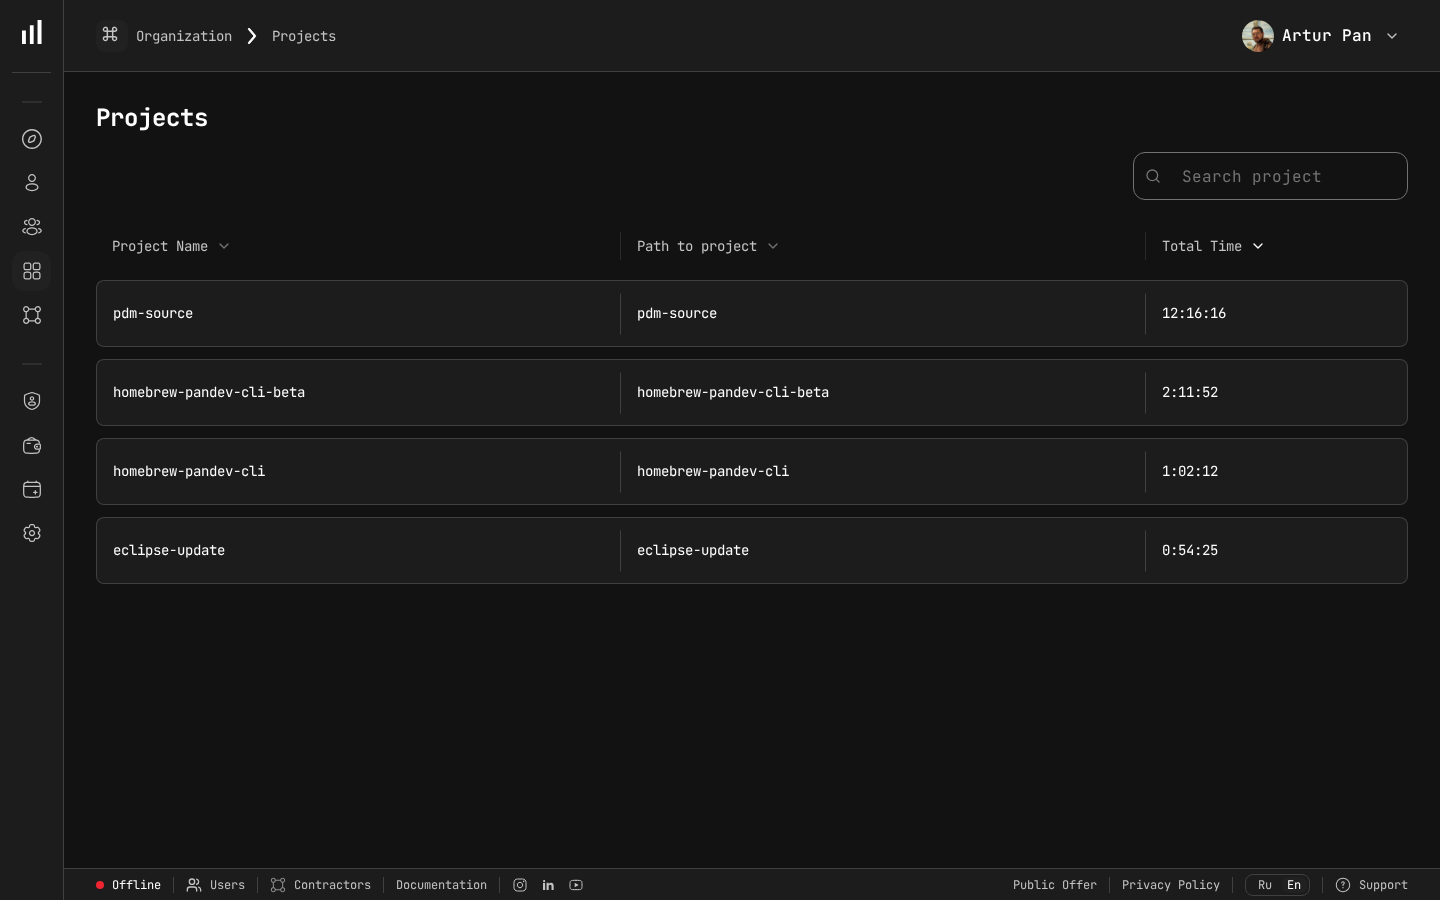
Project time data that feeds into hourly rate cost calculations.
Why Hourly Rate Tracking Matters
Every developer on your team has a different cost to the organization. When you track engineering costs using averages — "we have 40 developers at roughly $130K average" — you lose critical financial visibility.
Consider two scenarios:
Scenario A: A critical security fix requires 80 hours of work. Your two senior security engineers ($95/h loaded) handle it.
- Actual cost: 80h × $95 = $7,600
Scenario B: The same fix is routed to a team of mid-level developers ($65/h loaded) who need 120 hours because they lack domain expertise.
- Actual cost: 120h × $65 = $7,800
The costs are similar, but the outcomes are different. Scenario A took less calendar time, and the senior engineers produced more robust code. Without hourly rate tracking, both scenarios look identical in your sprint reports.
Now scale this to hundreds of decisions per quarter. The cumulative impact of assigning the wrong-cost resources to the wrong projects is significant. Stripe's Developer Coefficient research found that companies lose a substantial portion of engineering capacity to inefficiency — and misallocated resources are a core driver.
The Building Blocks of Cost Tracking
Effective cost tracking requires three data inputs:
Project Cost = Σ (Tracked_Hours_per_person × Loaded_Hourly_Rate_per_person)
Let's break down each component.
Component 1: Loaded Hourly Rate
The loaded hourly rate includes everything the company pays for a developer's time, not just their salary.
Loaded Hourly Rate = (Annual Salary + Benefits + Taxes + Equipment + Allocated_Overhead) / Annual_Working_Hours
Step-by-step calculation for a full-time employee:
| Component | Amount | Notes |
|---|---|---|
| Annual salary | $140,000 | Base compensation |
| Benefits (health, dental, 401k) | $28,000 | ~20% of salary |
| Payroll taxes (employer portion) | $10,710 | FICA, state taxes |
| Equipment and licenses | $4,000 | Laptop, monitors, IDE licenses |
| Office / remote stipend allocation | $6,000 | Per-person facility cost |
| Training and development | $2,000 | Conferences, courses |
| Total loaded cost | $190,710 | |
| Annual working hours | 1,880 | 52 weeks × 40h - PTO - holidays |
| Loaded hourly rate | $101.44/h |
A developer with a $140K salary actually costs the company $101/h when fully loaded. This is the number that matters for project costing.
For contractors, the calculation is simpler:
Contractor Loaded Rate = Invoice Rate × (1 + Management_Overhead_Percentage)
A contractor billing $85/h with a 10% management overhead has a loaded rate of $93.50/h.
Component 2: Tracked Hours Per Person
This is where most cost tracking systems fail. There are three approaches:
Approach 1: Manual time logging (least accurate) Developers fill out timesheets or log hours in Jira/Linear. Typical accuracy: 60-70%.
Approach 2: Allocation-based (moderate accuracy) Assign developers to projects at a percentage level: "Alex is 80% Project A, 20% Project B." Typical accuracy: 70-80%.
Approach 3: Automated IDE tracking (most accurate) IDE plugins capture actual coding time per repository, branch, and project. No manual input required. Typical accuracy: 90-95%.
Accuracy comparison:
| Method | Accuracy | Developer Burden | Granularity |
|---|---|---|---|
| Manual timesheets | 60-70% | High (15-30 min/day) | Task level |
| Allocation-based | 70-80% | None | Project level |
| Automated IDE tracking | 90-95% | None | Branch/commit level |
The accuracy gap between manual and automated tracking compounds quickly. On a multi-million-dollar annual engineering budget, even a moderate accuracy difference translates to hundreds of thousands in misattributed costs.
Component 3: Project Mapping
Hours need to map to projects, features, or cost centers. This mapping can happen through:
- Repository → Project — each repo belongs to a project
- Branch naming conventions — branches prefixed with ticket IDs map to features
- Commit messages — parsed for ticket references
- Manual tagging — for cross-project work
The most reliable approach combines automatic repository-to-project mapping with branch-level feature attribution.
Setting Up Hourly Rates: A Practical Tutorial
Here's a step-by-step guide to implementing hourly rate tracking for your engineering organization.
Step 1: Define Rate Tiers
You have two options: individual rates or role-based tiers.
Option A: Individual rates (highest accuracy)
Every developer has their own loaded hourly rate calculated from their actual compensation package. This gives you the most accurate cost data but requires maintaining individual rate records.
Best for: organizations with fewer than 100 engineers, or those with significant rate variation (mix of FTEs and contractors across multiple regions).
Option B: Role-based tiers (simpler to maintain)
Define rate tiers by role and level:
| Tier | Roles | Loaded Rate |
|---|---|---|
| Tier 1 | Junior developers, junior QA | $55/h |
| Tier 2 | Mid-level developers, designers | $75/h |
| Tier 3 | Senior developers, senior QA | $95/h |
| Tier 4 | Staff/Principal engineers, architects | $120/h |
| Tier 5 | Engineering managers (coding time) | $110/h |
| Contractor A | Offshore contractors | $45/h |
| Contractor B | Domestic contractors | $100/h |
Best for: organizations with 100+ engineers, or those with standardized compensation bands.
Step 2: Calculate Loaded Rates
For each tier or individual, calculate the fully loaded rate using the formula from Component 1. Important details to include:
- Don't forget employer taxes — these add 7-10% on top of salary in the US
- Include equity if material — for startups, equity grants can add 10-30% to total compensation
- Use actual working hours — don't assume 2,080 (52 × 40). After PTO, holidays, and sick days, most US companies see 1,800-1,920 actual hours
- Update rates quarterly or annually — after raise cycles, benefits changes, or contractor renegotiations
Step 3: Map Developers to Rates
Create a mapping between each team member and their rate. In PanDev Metrics, this is a straightforward configuration:
- Navigate to the Financial Analytics section
- For each developer, set their hourly rate (or assign them to a rate tier)
- Set effective dates — rates can change over time, and historical costs should use the rate that was active at the time
Step 4: Verify Project Mapping
Ensure that repositories and branches map correctly to projects and cost centers:
- Each repository should belong to at least one project
- Cross-project repositories should have branch-level mapping rules
- Shared infrastructure repositories can be allocated proportionally across projects
Step 5: Set Up Reporting
Configure the reports your stakeholders need:
For CFOs:
- Monthly cost by project / product line
- Cost variance: actual vs. budget
- Contractor vs. FTE cost split
- Quarter-over-quarter cost trends
For Engineering Leaders:
- Cost per team per sprint
- Cost per feature (linked to roadmap items)
- Resource allocation by project
- Cost efficiency: cost per story point or per deployment
For Project Managers:
- Real-time project cost tracker
- Burn rate and projected total cost
- Cost by team member (for resource planning)
Common Pitfalls and How to Avoid Them
Pitfall 1: Using Salary Instead of Loaded Rate
A $140K developer doesn't cost $67/h ($140K / 2,080h). They cost $101/h when you include benefits, taxes, overhead, and actual working hours. Using salary-based rates underestimates project costs by 30-50%.
Pitfall 2: Ignoring Part-Time Allocations
A developer split 60/40 between two projects doesn't always work 24h on one and 16h on the other each week. Automated tracking reveals the actual split, which often differs significantly from the planned allocation.
Pitfall 3: Forgetting to Update Rates
After annual raises, a $95/h developer might now cost $102/h. If you don't update rates, your cost tracking drifts further from reality every month. Set a calendar reminder to update rates after every compensation cycle.
Pitfall 4: Over-Engineering the System
You don't need perfect cost attribution from day one. Start with role-based tiers, project-level mapping, and automated time tracking. Refine to individual rates and feature-level attribution once the basics are working.
Pitfall 5: Making It Punitive
Cost tracking should inform decisions, not punish developers. If a senior developer's project costs more because their rate is higher, that's expected — they're likely tackling harder problems. Cost data is for resource allocation and budgeting, not performance management.
What Transparent Cost Tracking Looks Like in Practice
Here's what a mature cost tracking setup produces:
Monthly Project Cost Report:
| Project | FTE Hours | Contractor Hours | FTE Cost | Contractor Cost | Total | vs. Budget |
|---|---|---|---|---|---|---|
| Platform v3 | 1,240h | 320h | $117,800 | $28,800 | $146,600 | +8% |
| Mobile App | 680h | 0h | $57,800 | $0 | $57,800 | -3% |
| Internal Tools | 360h | 160h | $30,600 | $12,000 | $42,600 | +22% |
| Customer Fixes | 480h | 80h | $40,800 | $6,400 | $47,200 | -11% |
At a glance, the CFO can see that Internal Tools is 22% over budget (worth investigating) while Mobile App is slightly under.
Team Cost Efficiency:
| Team | Members | Monthly Cost | Deployments | Cost per Deploy |
|---|---|---|---|---|
| Platform | 8 | $92,000 | 47 | $1,957 |
| Frontend | 6 | $58,200 | 62 | $939 |
| Data | 5 | $61,000 | 23 | $2,652 |
| Mobile | 4 | $41,800 | 18 | $2,322 |
This doesn't mean the Data team is "worse" — their deployments are likely more complex. But it gives leadership a starting point for conversations about resource allocation and process improvement.
How PanDev Metrics Makes This Easy
Setting up comprehensive cost tracking typically requires cobbling together data from HR systems, time tracking tools, project management platforms, and spreadsheets. PanDev Metrics consolidates this:
- Built-in hourly rate management — set individual or tier-based rates with effective dates
- Automatic time tracking — 10+ IDE plugins capture coding time without any manual logging
- Multi-level cost aggregation — costs roll up from developer → team → project → product line
- Financial dashboards — pre-built reports for CFOs, engineering leaders, and project managers
- On-premise deployment — salary data, hourly rates, and project costs never leave your infrastructure
- Free tier available — start tracking costs without any upfront investment
The most important advantage: your developers don't need to change anything about their workflow. They code as usual, and the financial data appears automatically.
Key Takeaways
- Use loaded hourly rates, not salaries — the true cost of a developer is 30-50% higher than their salary alone
- Automate time tracking — manual timesheets waste developer time and produce inaccurate data
- Start with role-based tiers — you can refine to individual rates once the system is running
- Update rates after every compensation cycle — stale rates produce stale data
- Keep it transparent but not punitive — cost data is for better decisions, not surveillance
Ready to set up transparent cost tracking for your engineering team? PanDev Metrics includes financial analytics with hourly rates, project costing, and automated time tracking.