Hourly vs Monthly Rate: Tracking True Cost in Mixed Teams

A finance lead at a 12-person engineering team opens the cost dashboard. Total monthly burn: $58,000. Four full-time engineers on monthly salary, five contractors on hourly rates, three more outsourced through a vendor invoiced monthly. The dashboard shows a single average cost per developer. It is the wrong number, and every per-feature decision built on top of it is also wrong.
The conventional fix is the 160-hour conversion: divide a monthly rate by 160 to get an hourly equivalent, then compare. The US Bureau of Labor Statistics tracks average annual hours actually worked per employee at 1,791 hours. That is 149 hours per month, not 160. In Kazakhstan, a statutory 24-day vacation entitlement plus 13 paid holidays brings the effective figure closer to 144 hours. The 160 number is a hand-me-down from a country that no longer matches its own data.
{/* truncate */}
This article is for engineering finance leads running a mixed team (full-time staff, hourly contractors, and vendor-staff) who need one cost view that does not silently lie about which group costs more.
Why a single rate type breaks mixed teams
If you force everyone onto an hourly rate, your full-time staff look artificially cheap on the months they take vacation. If you force everyone onto a monthly rate, your contractors who only billed 80 hours look identical to a contractor who billed 180 hours. Both shortcuts hide signal that finance needs.
The International Labour Organization's 2023 Working Time and Work-Life Balance report quantifies the gap: contractors working through agencies bill, on average, 15-22% fewer hours per month than equivalent full-time employees once you account for unbillable time, transition gaps, and ramp-up. A mixed-team cost model that does not represent this is not a cost model. It's a guess wearing a spreadsheet.
The 2024 Stack Overflow Developer Survey reinforces the pattern. Compensation for independent contractors, normalized to a 40-hour week, runs 23-31% higher than equivalent full-time roles in the same country. But contractors only bill the hours they work. Vacation is unpaid, holidays are unpaid, sick days are unpaid. The annualized cost lands closer than the hourly rates suggest. Track only one rate type and you cannot see this.
The two rate types and when each one fits
PanDev Metrics models this through the UserRate table, where each user can have one or more rates and each rate carries a rateTypeId pointing to a row in user_rates_type. Two values exist today: HOURLY and MONTHLY. Below is the decision matrix we use with customers.
| Rate type | Best fit for | Why |
|---|---|---|
| HOURLY | Independent contractors, agency staff, on-demand specialists | Bills exactly what was worked. Vacation gaps don't distort cost. Easy to reconcile against contractor invoices. |
| MONTHLY | Full-time employees with fixed salary | Captures real cost-of-employment regardless of vacation, sick days, or onboarding ramp. Matches payroll reality. |
| MONTHLY (vendor) | Outsourced developers via vendor agreement | The vendor invoices a monthly fee per seat. Pass it through as monthly so cost matches what you actually pay the vendor. |
| HOURLY for full-time staff | Almost never | Punishes the company on every public holiday and sick day. Hides the true cost-of-employment. |
| MONTHLY for contractors | Almost never | Hides the fact that your contractor was off for two weeks. Cost looks identical to a busy month. |
The point is not that one is better than the other. The point is that a single team will need both at the same time, and the cost system has to support that without forcing reconciliation in spreadsheets.
How PanDev reconciles them
In the data model, each UserRate row has rate, rateTypeId, startPeriod, and endPeriod. A user can have multiple rates over time. A contractor who became a full-time hire mid-quarter has two overlapping rate records, one ending and one starting. Reports never lose history because the rate that was active during the calculation period is the one used.
The reconciliation rule, used whenever the platform compares cost across a mixed team:
if rateTypeId == HOURLY:
    cost = rate * tracked_hours
elif rateTypeId == MONTHLY:
    cost = rate                       # for the full period
    hourly_equivalent = rate / 160    # only when comparing per-hour cost
The /dashboard/finances view at the department level is where this matters. It shows total burn for the period, broken down by rate type, with a "normalized cost-per-hour" column derived from the formula above. The hardcoded 160 is the conversion constant, and it is also the limit of this approach, which we'll address below.
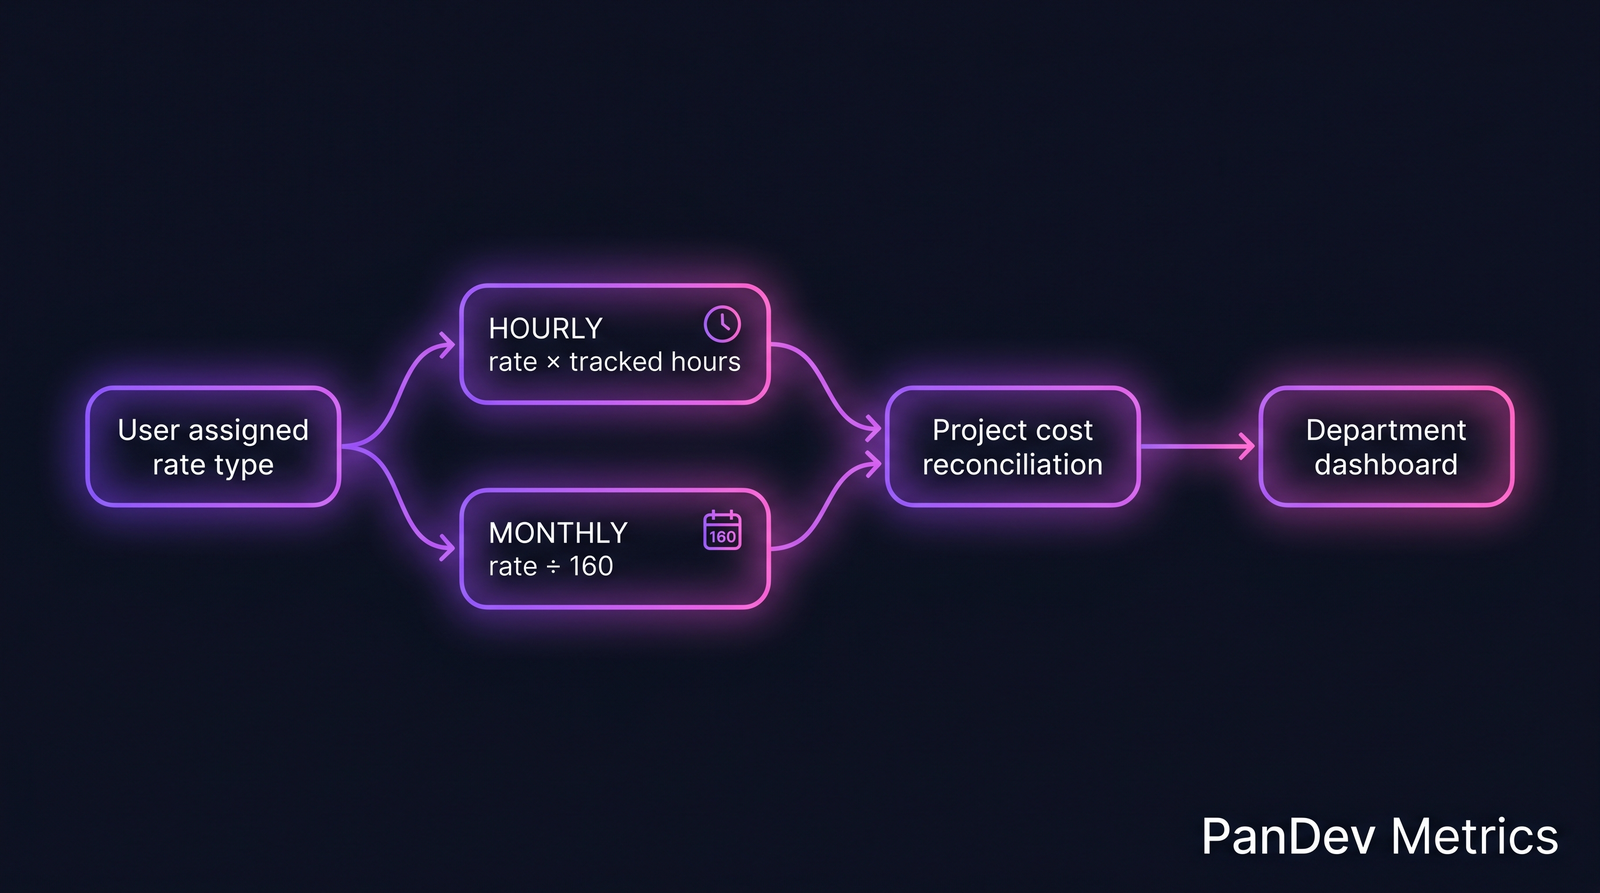 Each user's rate type determines how their cost reaches the project view. The dashboard never mixes the formulas. It reconciles only when comparing per-hour figures across types.
Worked example: 12-person team, $58K monthly burn
Here's the team, with rates as they sit in our reference data:
| # | Role | Type | Rate | Hours tracked | Monthly cost |
|---|---|---|---|---|---|
| 1-4 | Full-time engineers | MONTHLY | $7,000 each | 168 avg | $28,000 |
| 5-9 | Contractors | HOURLY | mix $45-$140/h | 142 avg | $16,800 (see breakdown) |
| 10-12 | Vendor outsourced | MONTHLY (vendor) | $4,400 each | 165 avg (reported by vendor) | $13,200 |
The contractor row is where the math gets interesting. The pool blends a senior at $140/h with three mids around $80/h and one junior at $45/h. Hours billed for the month total 142 average per contractor, but the weighted average rate lands lower than the headline $80/h once juniors are factored in. Real contractor monthly bill: $16,800 across all five. Plus $28K full-time and $13.2K vendor equals $58K total. Match.
Now the two cost views:
| View | Calculation | What it tells you |
|---|---|---|
| Naive single-rate view | $58,000 / 12 people = $4,833 / person / month | "Average dev costs $4.8K. Can we afford another?" Misleading. Says nothing about the split. |
| PanDev dual-rate view | $28K full-time (4) = $7K/person/mo; $16.8K contractors (5) = $3.4K/person/mo billed, but $80/h average; $13.2K vendor (3) = $4.4K/person/mo | Shows that contractors are 29% of total burn but only 28% of hours, and the per-hour cost gap between full-time ($7,000 / 160 = $43.75/h) and contractors ($80/h) is 83%. |
The naive view answers no business question. The dual-rate view answers three: which group costs most per hour worked, where the marginal hire is cheapest, and whether contractor utilization is healthy.
PanDev's f_mv_activity_total_user_daily_today materialized-view function exposes this daily: live cost per worker, joined to active rate, segmented by rate type. The number that lands on the CFO's screen at 9am is reconciled overnight, not stitched together in Excel before the meeting.
Where the 160-hour conversion breaks
The 160 constant is hardcoded in the MONTHLY → hourly reconciliation. It works for most US and APAC markets. It silently misrepresents three categories:
- France (legal 35h/week): 35 × 52 / 12 = 151.7 hours/month. A French employee on a €5,000/month salary is €32.96/h at 152, not €31.25/h at 160. A 5.5% understatement of true cost.
- Kazakhstan with full vacation entitlement: 24 working days vacation + 13 paid holidays out of 250 working days/year = effective 144 hours/month. A monthly rate of ₸600,000 is ₸4,167/h at 144, not ₸3,750/h at 160. An 11% gap.
- Senior engineers with onboarding ramp: a new hire at $9,000/month does not produce 160 hours of output in month one. The rate is correct, but cost-per-feature attribution distorts during the ramp window.
This is the honest limit. PanDev's current model uses a single 160 constant. Per-jurisdiction overrides are on the roadmap; today, customers operating in France or KZ-vacation-rich teams need to either accept the small understatement or override the rate manually using a custom hourly figure. We'd rather flag this than pretend the constant is universal.
Migration path: moving an existing team onto dual rates
If you're currently tracking everyone as one rate type, the move to dual takes one quarter of careful re-entry. The retroactive recalc handles the rest.
- Audit current rates. Pull the full
UserRatetable or its spreadsheet equivalent. For each person, decide: contracted by hours billed, or paid as employee? - Set
endPeriodon all current rates to the migration cutover date. Do not delete — history matters for retroactive reports. - Insert new rate rows with the correct
rateTypeIdandstartPeriodmatching the cutover. - Trigger
OverheadCoefficientFullRecalcCronJob(admin action) to recompute every dependent report: cost-per-feature, project burn, department dashboards. The recalc traverses the full history using the new rate rows. - Verify on the department finance view that totals match payroll + contractor invoices for the prior month. If they don't, there's a missing rate row — usually the vendor seat that was never modeled.
This same machinery is what protects against the worst-case finance scenario: a retroactive correction. If you discover three months later that a contractor's rate was wrong, you fix the rate row's startPeriod, kick the recalc, and every report from that date forward shows the corrected number. No spreadsheet untangling.
When this approach doesn't fit
Two cases where the dual-rate model is more friction than it's worth:
- Team of 4 or fewer, all the same employment type. If everyone is full-time or everyone is contractor, a single rate type is fine. The reconciliation only earns its keep at mixed-team scale.
- Pure agency model where the agency invoices one flat number per month. If you cannot break out individual contractor cost, model the whole agency as one synthetic "user" with a monthly rate. Dual-rate buys you nothing.
The model is built for the mixed case because that case is where the math is hardest. If your team is uniform, ignore the complexity.
Related reading
- Loaded Hourly Rate: The True Cost of an Engineer: the companion piece on how to compute the loaded rate that goes into either rate type.
- Hourly Rates and Cost Tracking: Transparent Financial Analytics: the foundational article on why hourly tracking matters at all.
- How Much Does Your Feature Cost? Calculating Cost Per Feature: what the dual-rate view enables once the rates are right.
- CFO's Guide to Engineering Metrics: the five questions a CFO should ask, with cost-per-feature as the lead.
The single hardest claim from all of the above: if your team is mixed and your finance dashboard shows one number, that number is hiding which group is actually expensive. Pick the rate type that matches the contract, not the spreadsheet you already have.