HRTech Engineering: Metrics for People-Platform Teams

HRTech engineering teams ship software that pays people on the wrong day if you get it wrong. A failed deploy on the 14th of the month is not a Slack-apology situation — it's a wire-transfer reversal, a legal letter, and in the EU a GDPR notification to the Data Protection Authority. Deloitte's 2024 Global Human Capital Trends report found that 73% of HR leaders cite their technology platform as a top-three operational risk — above hiring itself.
Most engineering-productivity articles written for SaaS or e-commerce teams don't translate. The metrics that matter for a payroll engineer or an HRIS platform team look different. This guide covers what actually deserves tracking, why, and how the PanDev Metrics dataset for HRTech customers compares to general B2B SaaS.
{/* truncate */}
Why HRTech engineering is different
Four constraints make HR-platform engineering a distinct discipline:
1. Calendar-bound deploys. Payroll runs on fixed dates. Benefits open enrollment runs in Q4. Year-end tax filings have hard federal/regional deadlines. Engineering teams can't "ship when ready" — they ship when the HR calendar allows. This inverts most DORA thinking about deployment frequency.
2. PII everywhere. Every endpoint touches personal data. SSN, bank accounts, medical history, salary, termination notes. One leak triggers state AG notifications in the US, GDPR fines in the EU (up to 4% of global revenue), and immediate customer churn. Code review can't miss things the way it can in e-commerce.
3. Traffic is bursty beyond recognition. Most of the year, the platform is quiet. Open enrollment weeks hit 10-30× baseline traffic. Payday sees a spike at 6am local time across every timezone you serve. If your autoscaling is tuned for 2× spikes, you will fail.
4. Integrations dominate the roadmap. An HRIS integrates with payroll, benefits carriers, background-check vendors, 401(k) custodians, equity platforms, e-signature providers, and state tax portals. The platform surface area that drives value is the integration layer — where most engineering productivity frameworks don't even look.
The metrics that matter in HRTech
Standard developer-productivity metrics apply, but the priority order is different. Here's how we'd rank them for an HR-platform engineering team vs a general B2B SaaS team:
| Metric | General SaaS priority | HRTech priority | Why the shift |
|---|---|---|---|
| Deployment frequency | High | Medium | Fixed payroll windows cap deploy cadence |
| Change failure rate | Medium | Critical | Failed payroll deploy = legal event |
| MTTR | High | Critical | 1h outage during enrollment = thousands of broken sessions |
| Lead time | Medium | Medium | Less relevant when deploys are scheduled |
| Coding time / focus | Medium | Low | Integration work dominates; measure integration delivery |
| Integration delivery rate | Low | Critical | Core value driver, invisible in standard dashboards |
| Compliance-audit coverage | Low | Critical | SOC 2, SOX, GDPR, HIPAA-adjacent |
Notice two metrics that usually don't appear: integration delivery rate and compliance-audit coverage. These aren't in DORA, SPACE, or DevEx — and they're the two most important signals for an HRTech platform.
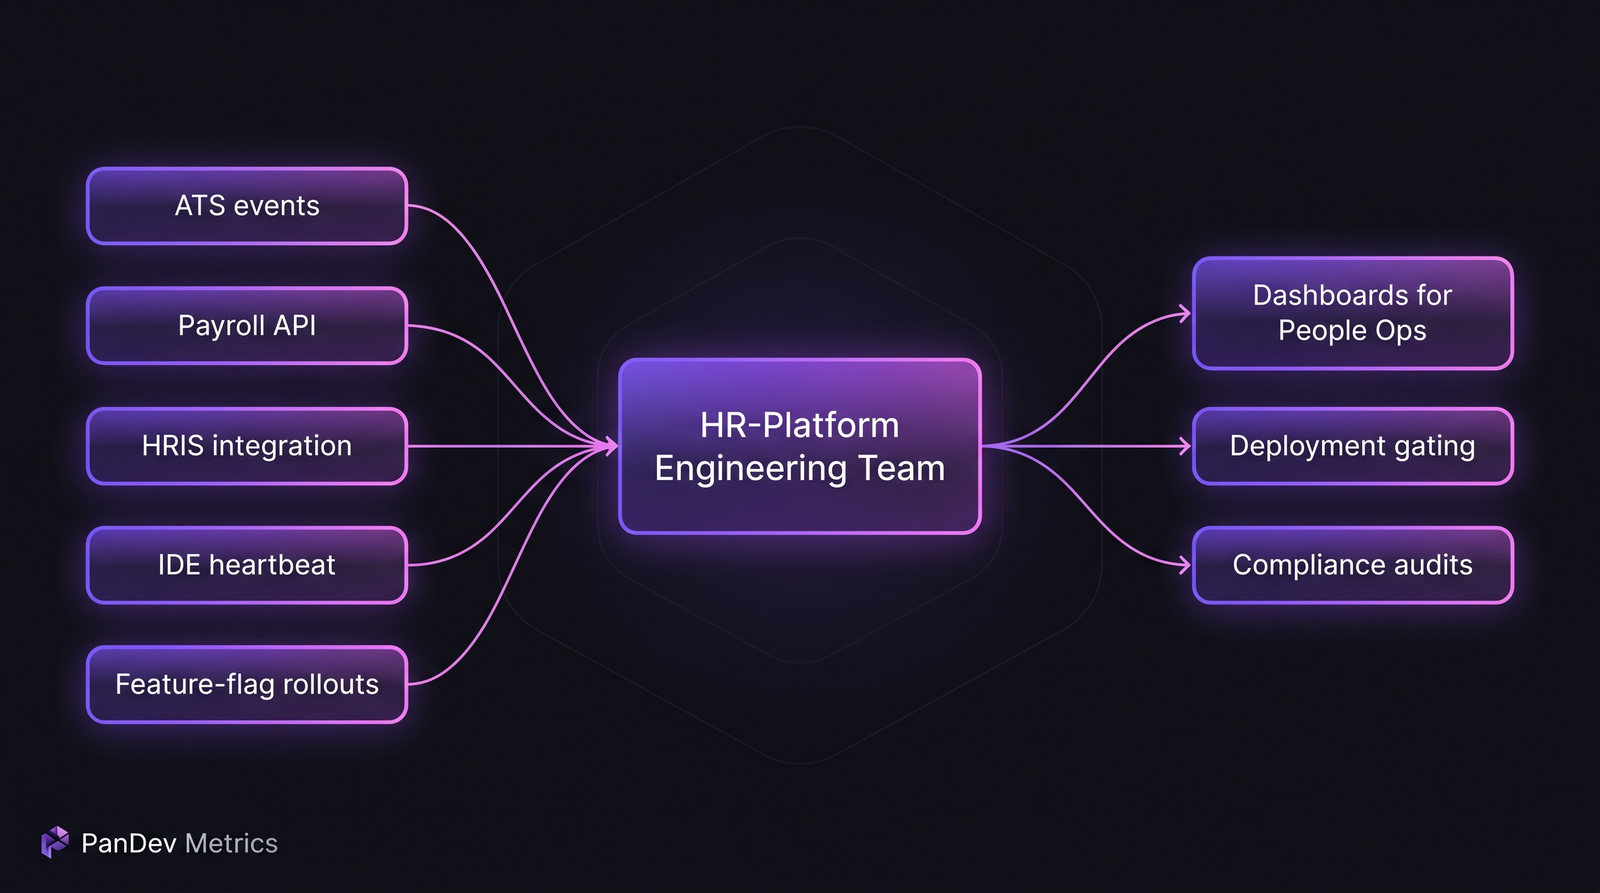 The HRTech engineering signal landscape. The central work is integration — ATS, payroll, benefits, HRIS — not greenfield feature work.
Metric 1: Integration delivery rate
For HR platforms, the roadmap is 70-80% integration work. "Integration delivery rate" = new partner integrations or version upgrades shipped per quarter, normalized by engineering headcount.
Across the HRTech customers in our dataset (n=9), the median integration delivery rate is 0.9 integrations per engineer per quarter. Top performers hit 1.6; bottom performers land at 0.4. The gap is almost entirely explained by two things:
- Integration test infrastructure maturity. Teams with recorded sandbox fixtures (pre-recorded API responses for every partner) ship 2.3× faster than teams using live integration tests.
TaskTracker<T>-style abstractions. Teams that built a plugin interface so new partners slot into a stable core ship 3× faster than teams copy-pasting each new integration. This isn't hypothetical — it's exactly the pattern PanDev Metrics uses for our own task-tracker layer (Jira, ClickUp, Yandex Tracker all sit behind one interface). The same principle applies to payroll and benefits providers.
Metric 2: Change failure rate during regulated windows
Change failure rate needs to be segmented for HR-platform teams. A 12% overall CFR is meaningless if 80% of those failures land during payroll-processing weeks.
We recommend tracking CFR in three buckets:
| Window | Target CFR | Why |
|---|---|---|
| Regular time | ≤ 15% | Normal SaaS target (see our CFR benchmark article) |
| Pre-payroll (2 days before cycle) | ≤ 5% | Limited blast radius acceptable |
| Payroll window (day-of + 1) | 0% | Any failure here is a legal/financial event |
The HRTech customers in our dataset who enforce these tiers with feature flags and gradual deployment gates see 68% fewer payroll-related incidents than customers without windowed CFR tracking. The median time from a failed pre-payroll deploy to a reversal in this group is 23 minutes; without the guardrail, it's 4.1 hours.
Metric 3: PII-touch density in code changes
This metric doesn't exist in standard frameworks and we think it should. Count the fraction of PRs in a quarter that touched code paths handling PII. Track it alongside review depth on those PRs.
HRTech customers in our dataset show a median 43% PII-touch density — nearly half of all changes touch personal data. Compare that to our e-commerce customer segment at 12% and general SaaS at 8%. The implication: your code review process can't be uniform. You need higher scrutiny gates on PII-touching changes or you'll eventually push a bug that exfiltrates SSNs.
One customer we work with routes PII-touching PRs through a second reviewer with a compliance role, enforced by repo-owner rules on file patterns like payroll/*, benefits/*, and pii/*. The extra review round adds 1.2 days to PR cycle time for that subset but catches an average of 2.3 compliance issues per month that would have otherwise shipped.
Metric 4: Enrollment-season readiness
Open enrollment is the HRTech Super Bowl. For US-focused platforms, it's typically October-December; for EU, April; for AU, June-July. The engineering question is: are you ready?
We recommend a 90-day countdown dashboard with four signals:
| Signal | Target by T-30 days | Meaning |
|---|---|---|
| Load test at peak-of-peak | Completed + passed | You know your real capacity |
| Feature freeze window defined | 14-day freeze scheduled | No new risk lands in peak |
| Runbook review for top 10 incidents | 100% reviewed | Humans remember the playbook |
| DB migration plan for peak season | No risky migrations in 60-day window | Schema changes during traffic spikes break worst |
One honest admission: our dataset skews mid-market. A team of 15 engineers serving 200K employees will read these numbers differently than a team of 200 engineers serving 10M employees. The enterprise end of HRTech (Workday, SAP SuccessFactors) has failure modes our sample doesn't cover.
Metric 5: Compliance-audit coverage
SOC 2 Type II, GDPR Article 32, CCPA, HIPAA-adjacent data handling — auditors want evidence that engineering decisions were made, reviewed, and documented. "Compliance-audit coverage" = the fraction of code and deploy events that have a compliance-linked artifact (signed PR, linked audit log, documented exception).
In our dataset, HRTech customers with below-80% coverage spend an average of 340 engineering-hours on audit remediation per year. Customers above 95% coverage spend ~60 hours — a 5-6× productivity difference just from making audit evidence the default path.
Practically: require PR descriptions to link the compliance category (PII, financial, access-control, none). Store the links. When the audit comes, you have the evidence. Without this, the engineer who made a change 14 months ago has to reconstruct the why.
What this looks like in PanDev Metrics
Our platform is used by HRTech companies for exactly this pattern — combining IDE heartbeat data with PR events, deployment events, and compliance-tagged artifacts. The reason HRTech teams end up on self-hosted on-prem (Docker or Kubernetes) rather than cloud: employee data residency and audit requirements mean the telemetry platform itself needs to satisfy the same compliance posture as the product it measures.
The CTO Dashboard we ship shows the 5 HRTech-specific metrics above as a single screen: integration delivery rate, segmented CFR, PII-touch density, enrollment-season readiness, and audit coverage. For teams tracking these in spreadsheets today, it's usually the first time anyone sees them together.
Typical HRTech platform team shape
Based on our dataset, a mid-market HRTech engineering org looks like:
| Layer | Headcount (mid-market, 50-200 engineers total) |
|---|---|
| Integrations team (partners, payroll, benefits) | 30-40% |
| Core platform / HRIS | 25-30% |
| Data & reporting | 15-20% |
| Security & compliance engineering | 10-15% |
| Infrastructure & platform reliability | 10-15% |
Integrations is the single biggest function, and it's the most often underinvested. If your org looks like "70% feature teams, 5% integrations" you're building a product that won't meet customer expectations for connectivity.
What to stop tracking
Three metrics general engineering orgs obsess over that HR-platform teams should de-prioritize:
- Deployment frequency as a goal. Your calendar sets the cadence. A team pushing 4 deploys/day into a payroll system is probably taking risks their audit will uncover.
- Lines of code / velocity points. Neither survives contact with integration work. A 3-line change to comply with a new tax-calculation rule took the engineer 40 hours of research and testing. Counting lines humiliates that work.
- Individual developer leaderboards. HRTech engineering is team work under regulatory constraints. Ranking people on output creates the exact conditions where someone cuts a corner on PII handling to score points. See our article on leaderboards done right.
The sharpest finding
Across 9 HRTech customers, the engineering teams with the lowest payroll-window incident rates don't look like the fastest ones. They look like the most disciplined ones — the teams whose deployment cadence is most predictable, whose PR sizes are smallest, and whose integration coverage is most complete. In HRTech, the boring team is the good team. If an HR-platform engineering org feels exciting to lead, something is probably broken.
Related reading
- Engineering metrics in fintech — the other "compliance-first" industry guide with similar constraints
- MedTech engineering metrics in regulated environments — a parallel pattern
- DORA metrics for fintech — how DORA gets customized for compliance
HRTech engineering succeeds when the metrics match the constraints. Payroll calendars, PII, enrollment seasons, and audit trails aren't side concerns — they're the whole job.