IDE Plugins: How to Track Activity in VS Code, IntelliJ, Eclipse, Xcode, and More

Commits and pull requests tell you what was delivered. But they miss the hours of debugging, refactoring, and research that happen between pushes. IDE plugins capture that missing layer — how much time was spent coding, which files were touched, and when developers were most active.
PanDev Metrics offers plugins for VS Code, JetBrains (IntelliJ, PhpStorm, WebStorm), Eclipse, Xcode, Visual Studio, PL/SQL Developer, a Chrome extension, and a CLI for everything else. This guide covers installation and configuration for all of them.
{/* truncate */}
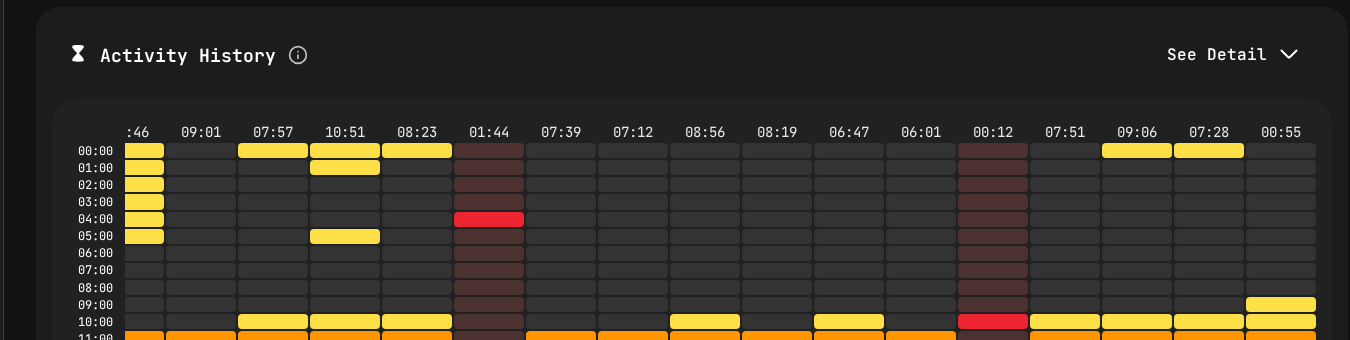 Once IDE plugins are installed, PanDev visualizes your team's coding activity as a heatmap — showing exactly when developers are most active throughout the week.
How IDE Tracking Works
Every PanDev IDE plugin works the same way under the hood:
- The plugin detects coding activity — keystrokes, file saves, file switches, debugging sessions
- It records heartbeats — lightweight events with a timestamp, file path, project name, language, and activity type
- Heartbeats are batched and sent to the PanDev API every 2 minutes
- PanDev aggregates heartbeats into coding sessions — continuous activity windows with gaps of less than 5 minutes
No code content is ever sent. PanDev only tracks metadata: file names, project names, timestamps, and languages.
What Counts as "Active" Time
| Activity | Tracked? |
|---|---|
| Typing code | Yes |
| Navigating between files | Yes |
| Using the debugger | Yes |
| Running tests from IDE | Yes |
| Reading code (scrolling, no keystrokes for 5+ min) | No |
| IDE open but minimized | No |
| Meetings on a different screen | No |
The 5-minute inactivity threshold is configurable per organization.
Before You Start: Get Your API Key
Every plugin needs an API key to authenticate with PanDev:
- Log in to PanDev Metrics
- Go to Profile → API Key
- Click Generate Key (or copy your existing key)
Your API key: pdm_k_xxxxxxxxxxxxxxxxxxxxxxxxxxxxxxxx
You'll use this key during plugin setup. It's tied to your personal account — each developer generates their own.
VS Code
The most popular IDE in our user base. Installation takes 30 seconds.
Install
- Open VS Code
- Go to Extensions (Ctrl+Shift+X / Cmd+Shift+X)
- Search for "PanDev Metrics"
- Click Install
Alternatively, install via command line:
code --install-extension pandev.pandev-metrics
Configure
After installation, VS Code prompts for your API key:
- A notification appears: "PanDev Metrics: Enter your API key"
- Paste your API key and press Enter
Or configure manually in settings.json:
{
  "pandev.apiKey": "pdm_k_xxxxxxxxxxxxxxxxxxxxxxxxxxxxxxxx",
  "pandev.apiUrl": "https://api.pandev-metrics.com"
}
For on-premise deployments, change apiUrl to your internal PanDev instance.
Verify
- Open any project and type a few characters
- Check the VS Code status bar — you should see a PanDev icon with a green dot
- In PanDev Metrics, go to Dashboard → Activity Feed — your coding session should appear within 2 minutes
VS Code-Specific Settings
{
  "pandev.apiKey": "pdm_k_xxxx",
  "pandev.apiUrl": "https://api.pandev-metrics.com",
  "pandev.excludeFiles": [
    "*.log",
    "*.lock",
    "node_modules/**"
  ],
  "pandev.projectDetection": "git",
  "pandev.debug": false
}
| Setting | Description |
|---|---|
excludeFiles | Glob patterns for files to ignore |
projectDetection | How to detect the project name: git (from remote URL), folder (from folder name), or custom |
debug | Enable verbose logging in the Output panel |
JetBrains (IntelliJ IDEA, PhpStorm, WebStorm, PyCharm, GoLand, Rider)
One plugin covers the entire JetBrains family.
Install
- Open your JetBrains IDE
- Go to Settings → Plugins → Marketplace
- Search for "PanDev Metrics"
- Click Install → Restart IDE
Or install via JetBrains Toolbox CLI:
# Example for IntelliJ IDEA
idea installPlugins pandev.pandev-metrics
Configure
After restart, a setup dialog appears:
- Paste your API key
- (Optional) Set the API URL for on-premise deployments
- Click Save
The configuration is stored in:
~/.config/JetBrains/IntelliJIdea2025.3/options/pandev.xml
Verify
- Open a project, make some edits
- Check the bottom-right status bar for the PanDev icon
- Click it to see your current session stats: coding time today, current project, last heartbeat sent
JetBrains-Specific Settings
Settings → Tools → PanDev Metrics

API Key:          pdm_k_xxxx
API URL:          https://api.pandev-metrics.com
Timeout (sec):    30
Exclude patterns: *.log, *.lock, build/**, .idea/**
Log level:        INFO
Eclipse
Eclipse users aren't forgotten. The PanDev plugin works with Eclipse 2023-03 and later.
Install
- Open Eclipse
- Go to Help → Eclipse Marketplace
- Search for "PanDev Metrics"
- Click Install → follow the wizard → Restart Eclipse
Or install via update site:
Help → Install New Software → Add...
Name: PanDev Metrics
URL: https://plugins.pandev-metrics.com/eclipse/
Configure
- Go to Window → Preferences → PanDev Metrics
- Enter your API key
- Click Apply and Close
Verify
Check the Eclipse status bar (bottom) for the PanDev icon. Hover to see connection status.
Xcode
For iOS and macOS developers.
Install
The Xcode plugin is distributed as a macOS app that runs as a background service:
brew install --cask pandev-metrics
Or download from pandev-metrics.com/downloads.
Configure
- Launch PanDev Metrics from Applications
- The app appears in your menu bar
- Click the menu bar icon → Settings
- Enter your API key
- Grant accessibility permissions when prompted (required to detect Xcode activity)
System Settings → Privacy & Security → Accessibility
  ✅ PanDev Metrics
How It Works
Unlike traditional IDE plugins, the Xcode integration monitors the active Xcode process at the OS level. It detects:
- File open/save events
- Active file changes
- Build and run events
- Debugging sessions
Verify
- Open an Xcode project and start coding
- Click the PanDev menu bar icon — it shows current session info
- Check PanDev Metrics dashboard for activity within 2 minutes
Visual Studio (Windows)
For .NET, C++, and other Visual Studio developers.
Install
- Open Visual Studio
- Go to Extensions → Manage Extensions
- Search for "PanDev Metrics"
- Click Download → Restart Visual Studio to complete installation
Or install via the VSIX package:
# Download from pandev-metrics.com/downloads
code --install-extension pandev-metrics.vsix
Configure
- Go to Tools → Options → PanDev Metrics
- Enter your API key
- Click OK
Visual Studio-Specific Notes
- Supports Visual Studio 2019 and later
- Tracks C#, C++, F#, VB.NET, and all other Visual Studio languages
- Solution name is used as the project name by default
PL/SQL Developer
For Oracle database developers using PL/SQL Developer.
Install
- Download the PanDev plugin DLL from pandev-metrics.com/downloads
- Copy it to the PL/SQL Developer plugins directory:
C:\Program Files\PLSQL Developer\PlugIns\pandev-metrics.dll
- Restart PL/SQL Developer
- Go to Tools → Configure Plug-Ins → enable PanDev Metrics
Configure
After enabling, a configuration dialog appears:
- Enter your API key
- Set the API URL (default or on-premise)
- Click Save
What Gets Tracked
- Active editing in SQL windows
- Package, procedure, and function editing
- Time spent in the SQL beautifier and query builder
Chrome Extension
The Chrome extension tracks time spent on developer-related web activities:
Install
- Visit the Chrome Web Store and search for "PanDev Metrics"
- Click Add to Chrome
- Click the extension icon → enter your API key
What Gets Tracked
The extension tracks time on developer-related sites only:
Tracked domains (default):
  ✅ github.com
  ✅ gitlab.com
  ✅ bitbucket.org
  ✅ stackoverflow.com
  ✅ developer.mozilla.org (MDN)
  ✅ docs.microsoft.com
  ✅ Your Jira / ClickUp instance (configurable)

Not tracked:
  ❌ Social media
  ❌ Email
  ❌ Shopping sites
  ❌ Everything else
You can customize the domain list in the extension settings.
Privacy
The Chrome extension sends only the domain name and page title to PanDev — never the full URL, page content, or any sensitive data. It can be fully disabled for specific domains.
CLI (Command Line)
For editors without plugin support (Vim, Neovim, Emacs, nano) or custom development environments.
Install
# macOS / Linux
curl -fsSL https://get.pandev-metrics.com/cli | sh

# Or via package managers
brew install pandev-cli          # macOS
sudo apt install pandev-cli      # Debian/Ubuntu
sudo yum install pandev-cli      # RHEL/CentOS
Configure
pandev-cli setup
# Enter your API key when prompted
# Configuration saved to ~/.pandev/config.toml
Configuration file:
# ~/.pandev/config.toml
api_key = "pdm_k_xxxxxxxxxxxxxxxxxxxxxxxxxxxxxxxx"
api_url = "https://api.pandev-metrics.com"
exclude_patterns = ["*.log", "*.lock", "node_modules/**"]
Usage with Vim/Neovim
Add a file-save hook to your .vimrc or init.vim:
autocmd BufWritePost * silent! execute '!pandev-cli heartbeat --file ' . shellescape(expand('%:p')) . ' --project ' . shellescape(fnamemodify(getcwd(), ':t')) . ' &'
For Neovim, a dedicated Lua plugin is available:
-- ~/.config/nvim/lua/plugins/pandev.lua
return {
  "pandev-metrics/pandev.nvim",
  config = function()
    require("pandev").setup({
      api_key = os.getenv("PANDEV_API_KEY"),
    })
  end,
}
Usage with Emacs
;; ~/.emacs.d/init.el
(use-package pandev
  :ensure t
  :config
  (setq pandev-api-key (getenv "PANDEV_API_KEY"))
  (global-pandev-mode 1))
Manual Heartbeats
For custom integrations, send heartbeats directly:
pandev-cli heartbeat \
  --file /path/to/file.py \
  --project my-project \
  --language python \
  --activity coding
Verifying Everything Works
After installing plugins on your team's machines, verify data flow:
Individual Check
Each developer can verify at Profile → Activity → Today:
Today's Activity
━━━━━━━━━━━━━━━
Total coding time:  2h 34m
Projects:           backend-api (1h 48m), frontend (46m)
Languages:          Python (1h 12m), TypeScript (52m), SQL (30m)
Editors:            VS Code (1h 48m), IntelliJ IDEA (46m)
Last heartbeat:     12 seconds ago ✅
Admin Check
As an admin, verify at Settings → Team → Plugin Status:
Developer        Plugin            Version    Last Heartbeat    Status
──────────────────────────────────────────────────────────────────────
Alice Wong       VS Code           2.4.1      2 min ago         ✅ Active
Bob Park         IntelliJ IDEA     2.4.0      5 min ago         ✅ Active
Chen Li          VS Code           2.3.8      3 days ago        ⚠️ Stale
Diana Ray        Eclipse           2.4.1      1 min ago         ✅ Active
Erik Svensson    —                 —          Never             ❌ Not installed
Follow up with developers who show "Stale" or "Not installed" — common issues are expired API keys or corporate proxy blocking.
Troubleshooting
| Issue | Solution |
|---|---|
| Plugin installed but no data in PanDev | Check the API key. Regenerate if unsure |
| "Connection timeout" in plugin logs | Corporate proxy or firewall blocking api.pandev-metrics.com. Configure proxy settings in the plugin or whitelist the domain |
| Activity shows 0 minutes despite coding | Check excluded file patterns — you might be excluding the files you're editing |
| Wrong project name | Adjust projectDetection setting. For git-based detection, ensure the folder has a .git directory with a remote URL |
| Multiple editors counting double | PanDev deduplicates overlapping heartbeats. If both VS Code and Chrome are active simultaneously, each gets its own activity type |
"As a CTO and for our tech leads, it's important to see not individual employees but the state of the development process: where it's efficient and where it breaks down. The product allows natively collecting metrics right from the IDE, without feeling controlled or surveilled." — Maksim Popov, CTO ABR Tech (Forbes Kazakhstan, April 2026)
Privacy and Data
PanDev IDE plugins collect metadata only:
- File path and name
- Project name (from git remote or folder name)
- Programming language
- Timestamp
- Editor name and version
- Activity type (coding, debugging, building)
Never collected: file contents, code snippets, clipboard data, keystrokes, screenshots, or anything that could expose source code.
All data is encrypted in transit (TLS 1.3) and at rest (AES-256). For maximum control, deploy PanDev on-premise and keep all data within your network. For details on the VS Code extension API model, see the VS Code Extension API documentation. JetBrains plugin architecture is documented in the IntelliJ Platform Plugin SDK.
Start tracking real coding time. Install PanDev plugins across your team in minutes. Get started at PanDev Metrics.