How to Implement DORA Metrics in Your Team in 2 Weeks

Most DORA adoption efforts fail not because of tooling or data — but because they become 6-month projects that die in committee. The Accelerate research (Forsgren, Humble, Kim, 2018) showed that organizations with visible delivery metrics improve faster. The key word is visible: a dashboard nobody looks at is worse than no dashboard, because it creates the illusion of measurement. Here's a day-by-day plan to go from zero to live DORA dashboards in two weeks — fast enough that the momentum doesn't dissipate.
{/* truncate */}
Before You Start: Prerequisites
This guide assumes:
- You're an Engineering Manager (or similar role) with a team of 5–30 engineers
- Your team uses Git (GitLab, GitHub, Bitbucket, or Azure DevOps)
- You have a CI/CD pipeline that deploys to production
- You have some form of incident tracking (even if it's a Slack channel)
- You have authority to introduce new tools and processes to your team
If you're missing any of these, the plan still works — you'll just need to substitute or skip certain steps.
Week 1: Setup and Baseline
Day 1: Define Your Metrics Precisely
The biggest source of DORA measurement failure is ambiguous definitions. Before connecting any tools, write down exactly how you'll measure each metric.
Deployment Frequency
Answer these questions for your team:
- What counts as a "deployment"? (Recommended: any code change that reaches production, triggered by CI/CD or manually)
- Do you count deploys to staging? (No — DORA measures production only)
- Do you count hotfixes? (Yes)
- Do you count rollbacks? (Yes — a rollback is a deployment)
- Do you count infrastructure-only changes? (Recommended: only if they affect application behavior)
Lead Time for Changes
- Where does the clock start? (Recommended: first commit on the branch)
- Where does the clock stop? (Recommended: code running in production)
- Do you count calendar time or business hours? (Recommended: calendar time — the DORA research uses calendar time)
- How do you handle MRs that sit as drafts for a week before being marked "ready"? (Recommended: clock starts at first commit, not when MR is marked ready)
Change Failure Rate
- What counts as a "failure"? (Recommended: any deployment that requires a rollback, hotfix, or unplanned remediation within 24 hours)
- Do you count performance degradations? (Recommended: yes, if they breach your SLO)
- Do you count feature bugs found post-deploy? (Recommended: yes, if they require a hotfix within 24 hours)
- How do you handle partial failures? (e.g., deploy worked but one endpoint broke) (Recommended: count it as a failure)
MTTR (Mean Time to Restore)
- When does the clock start? (Recommended: when the incident is detected — either by monitoring alert or customer report)
- When does the clock stop? (Recommended: when service is verified restored — metrics back to normal, smoke tests passing)
- Do you include only production incidents? (Recommended: yes)
- What severity levels do you include? (Recommended: all severities for now; you can segment later)
Write these definitions in a shared document. They don't need to be perfect. They need to be explicit. You'll refine them in Week 2.
Day 2: Choose Your Tooling
You have three options:
Option A: Build It Yourself (Not Recommended)
Query your Git API, CI/CD API, and incident tracker. Build dashboards in Grafana or Looker. This works for a proof of concept but requires ongoing maintenance, edge-case handling, and typically consumes 2–4 weeks of an engineer's time.
Option B: Use a DORA Platform
Tools like PanDev Metrics connect to your Git provider, CI/CD system, and project tracker. They calculate all four metrics (including Lead Time broken into Coding, Pickup, Review, and Deploy stages) automatically. Setup typically takes 30–60 minutes.
Option C: Spreadsheet Baseline (Temporary)
Export data from your Git provider and CI/CD system. Calculate metrics in a spreadsheet. This is appropriate for a one-time baseline assessment but is unsustainable for ongoing tracking.
Recommendation: Use a platform (Option B) for automated, ongoing tracking. If budget approval takes time, start with Option C for the baseline and switch later.
Day 3: Connect Your Data Sources
If using a platform like PanDev Metrics:
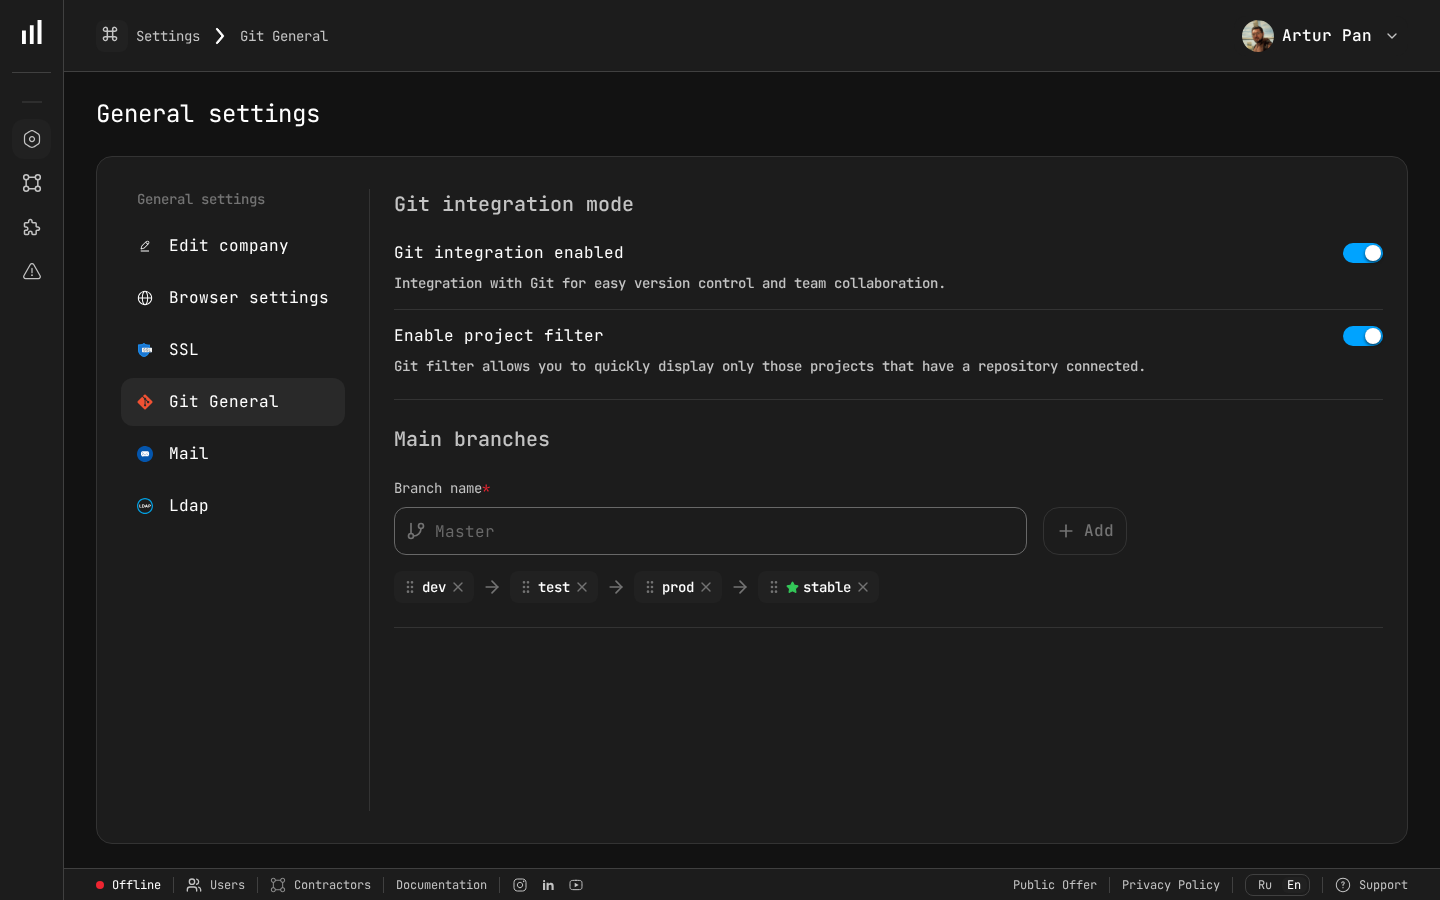
Git integration settings in PanDev Metrics — Step 1 of DORA implementation.
-
Connect your Git provider (GitLab, GitHub, Bitbucket, or Azure DevOps). This gives you:
- Deployment Frequency (from deployment/merge events)
- Lead Time (from commit and MR timestamps)
- Lead Time stages (from MR lifecycle events)
-
Connect your project tracker (Jira, ClickUp, or Yandex.Tracker). This gives you:
- Task-level context for changes
- Correlation between tickets and code changes
-
Connect your CI/CD pipeline data. This gives you:
- Deploy timestamps
- Build/test durations
- Deploy success/failure status
-
Set up incident tracking integration (if available). This gives you:
- MTTR calculation
- Change Failure Rate correlation
If doing this manually: export the last 90 days of merged MRs, deployments, and incidents. Organize them in a spreadsheet with timestamps.
Day 4: Calculate Your Baseline
Run the numbers for the last 90 days. Fill in this table:
| Metric | Your Value | DORA Level | Target |
|---|---|---|---|
| Deployment Frequency | ___ per week | Elite / High / Medium / Low | |
| Lead Time for Changes | ___ days (median) | Elite / High / Medium / Low | |
| Change Failure Rate | ___% | Elite / High / Medium / Low | |
| MTTR | ___ hours (median) | Elite / High / Medium / Low |
Use median, not mean. Means are distorted by outliers.
Benchmark reference (2023 State of DevOps Report):
| Metric | Elite | High | Medium | Low |
|---|---|---|---|---|
| Deploy Frequency | On-demand (multiple/day) | Daily to weekly | Weekly to monthly | Less than monthly |
| Lead Time | Less than 1 hour | 1 day to 1 week | 1 week to 1 month | More than 1 month |
| Change Failure Rate | 0–15% | 0–15% | 16–30% | 46–60% |
| MTTR | Less than 1 hour | Less than 1 day | 1 day to 1 week | More than 1 week |
Don't set targets yet. Just understand where you are.
Day 5: Present to Your Team
This is the most important day of the entire implementation. If you skip this or do it poorly, DORA metrics will be seen as surveillance, and your team will resist.
Structure of the presentation (30 minutes):
-
What DORA metrics are and why they exist (5 minutes)
- Research-backed by 10+ years of data from 36,000+ professionals (Forsgren et al., Accelerate, 2018)
- Measures the delivery system, not individual developers — the SPACE framework (Forsgren, Storey, Maddila et al., 2021) explicitly warns against individual-level application
- Teams that score well deliver faster AND have fewer incidents
-
Our baseline numbers (10 minutes)
- Show each metric and where the team falls on the DORA scale
- Be honest about what's good and what's not
- Frame gaps as process problems, not people problems
-
What we're NOT doing (5 minutes)
- Not using metrics for individual performance evaluation
- Not setting arbitrary targets
- Not punishing anyone for current numbers
- Not adding more process or bureaucracy
-
What we ARE doing (5 minutes)
- Making delivery performance visible
- Identifying one improvement area to work on
- Tracking progress over time
-
Questions and concerns (5 minutes)
- Expect pushback. Listen to it. Address it honestly.
Common concerns and how to address them:
| Concern | Response |
|---|---|
| "You're going to judge me by commit count" | "DORA metrics are team-level. We're measuring the pipeline, not people." |
| "This is just micromanagement" | "The goal is to find process bottlenecks. If Lead Time is 2 weeks, I want to know if it's slow CI or slow reviews — so I can fix the system." |
| "Our numbers are bad because of X" | "Great — that's exactly the kind of insight we need. Let's document that context." |
| "We don't have time for metrics" | "The metrics are automated. No one needs to do manual tracking. The 30-minute weekly review replaces guessing about our delivery performance." |
Week 2: Refine and Act
Day 6–7: Deep Dive Into Your Worst Metric
Look at your baseline. Identify the metric where you're furthest from "High" performance. This is your focus area.
If Deployment Frequency is your weakest:
- Map your deployment process end-to-end. Where are the manual steps?
- Identify what prevents you from deploying more often. Is it slow CI? Manual QA? Change approval boards?
- Pick one blocker to remove in the next 2 weeks.
If Lead Time is your weakest:
- Break it into stages (Coding, Pickup, Review, Deploy). PanDev Metrics does this automatically; if doing manually, sample 20 recent MRs and calculate each stage.
- Identify the longest stage. This is where improvement effort should focus.
- Common finding: Pickup Time (waiting for review) is the #1 bottleneck.
If Change Failure Rate is your weakest:
- Categorize your last 10 failures by root cause: code bug, config error, dependency issue, infrastructure, other.
- Identify the most common category.
- Implement one prevention measure for that category (e.g., config validation in CI, dependency version pinning).
If MTTR is your weakest:
- Time the last 5 incidents: detection → triage → remediation → verification.
- Identify the longest phase.
- Common finding: detection takes too long because monitoring is inadequate.
Day 8: Set Your First Target
Now that you understand the baseline and the biggest bottleneck, set one target:
Rules for good targets:
- One metric only. Don't try to improve everything at once.
- Specific and time-bound. "Reduce median Lead Time from 8 days to 5 days within 6 weeks."
- Achievable without heroics. Aim for a 20–40% improvement, not a 90% improvement.
- Team-owned. The team should agree this is worth pursuing.
Example targets:
| Current State | Target | Timeline |
|---|---|---|
| Deploy monthly | Deploy biweekly | 4 weeks |
| Lead Time 12 days | Lead Time 7 days | 6 weeks |
| CFR 25% | CFR below 18% | 8 weeks |
| MTTR 6 hours | MTTR under 2 hours | 4 weeks |
Day 9: Establish Your Review Cadence
DORA metrics are useless if nobody looks at them. Set up:
Weekly metric review (15 minutes, part of existing team meeting):
- Display the DORA dashboard
- Note any changes from last week
- Discuss: "Is our improvement initiative making a difference?"
- No blame, no individual call-outs
Monthly deep dive (30 minutes, standalone):
- Review trend over the last month
- Assess progress toward target
- Decide: continue current initiative or pivot?
- Identify next improvement area if current target is met
Quarterly review with leadership (30 minutes):
- Present DORA performance and trends
- Highlight improvements and their business impact
- Request resources if needed (e.g., CI/CD investment, tooling budget)
Day 10: Start Your First Improvement Sprint
Pick one concrete action based on your Day 6–7 analysis. Examples:
For Lead Time — reducing Pickup Time:
- Implement CODEOWNERS for automatic reviewer assignment
- Set team SLA: "Every MR reviewed within 4 business hours"
- Create a "Needs Review" dashboard or Slack notification
For Deployment Frequency — removing manual gates:
- Automate one manual step in your deployment process
- Replace one approval gate with an automated check
- Set a "deploy day" if you don't have a regular cadence
For Change Failure Rate — improving test coverage:
- Add smoke tests for the top 3 user-facing flows
- Fix or delete flaky tests (identify the top 5 flakiest)
- Add deployment-correlated error tracking
For MTTR — improving detection:
- Set up alerting for error rate and latency on your primary service
- Create a basic runbook for the most common incident type
- Practice a rollback (actually do it, in production, with a no-op change)
After Week 2: The Ongoing Rhythm
Congratulations — you now have DORA metrics tracking. The hard part isn't setup; it's sustaining the practice. Here's how to keep it alive:
Monthly Checkpoints
| Month | Activity |
|---|---|
| Month 1 | Baseline established, first improvement sprint running |
| Month 2 | Evaluate first sprint results, start second improvement |
| Month 3 | Review trends, adjust targets, present to leadership |
| Month 4–6 | Continue improvement sprints, refine definitions |
| Month 6 | Full retrospective: where were we, where are we, what worked |
Signs It's Working
- Team discusses DORA metrics organically (not just in formal reviews)
- Developers suggest improvements to the delivery process
- Lead Time or Deployment Frequency is measurably better
- New team members onboard faster because the process is visible
Signs It's Not Working
- Nobody looks at the dashboard
- Metrics are discussed only to assign blame
- Numbers improve but team sentiment worsens (gaming)
- Targets are set but no action is taken to achieve them
If it's not working, the most common cause is #2 — the metrics are being used punitively. Go back to Day 5 and reinforce the purpose.
Common Pitfalls and How to Avoid Them
Pitfall 1: Measuring Individuals
Symptom: "Let's see who has the longest Lead Time."
Fix: Aggregate all metrics at the team level. Never display individual developer metrics in team dashboards. If you need individual-level data for coaching, use it 1:1, privately, with context.
Pitfall 2: Optimizing One Metric at the Expense of Others
Symptom: Deployment Frequency goes up, but Change Failure Rate doubles.
Fix: Always display all four DORA metrics together. Improvement in one metric should not degrade another. If it does, you're going too fast.
Pitfall 3: Perfect Definitions Before Starting
Symptom: "We can't start tracking until we agree on whether a canary rollback counts as a failure."
Fix: Start with "good enough" definitions. Note the edge cases. Refine definitions monthly. Consistency matters more than perfection — if you count the same way every week, the trend is valid even if the absolute number is debatable.
Pitfall 4: Dashboard Without Action
Symptom: Beautiful Grafana dashboard. No improvement in 6 months.
Fix: Every weekly review must end with: "What one thing are we doing this week to improve?" If the answer is "nothing," cancel the meeting and try again when there's energy for improvement.
Pitfall 5: Comparing Teams Without Context
Symptom: "Team Alpha deploys 3x per day. Why can't Team Beta?"
Fix: Team Alpha builds a web frontend. Team Beta builds a banking core system with regulatory approval requirements. Context matters. Compare teams to their own historical baseline, not to each other.
The Tooling Decision
A quick comparison of approaches:
| Approach | Setup Time | Ongoing Effort | Coverage | Cost |
|---|---|---|---|---|
| Spreadsheet | 2–4 hours | 2–3 hours/week | Basic 4 metrics | Free |
| Custom scripts + Grafana | 2–4 weeks | 4–8 hours/week | 4 metrics + custom | Engineer time |
| DORA platform (e.g., PanDev Metrics) | 30–60 minutes | 15 min/week (review) | 4 metrics + stages + IDE data | Subscription |
For this 2-week tutorial, any approach works. For ongoing tracking, a platform pays for itself quickly — the 2–3 hours/week spent on spreadsheet maintenance is better spent on actually improving the metrics.
PanDev Metrics specifically offers:
- Automated DORA metrics from GitLab, GitHub, Bitbucket, Azure DevOps
- Lead Time broken into 4 stages (Coding, Pickup, Review, Deploy)
- IDE heartbeat tracking from 10+ plugins for Coding Time visibility
- Integration with Jira, ClickUp, and Yandex.Tracker
- AI assistant (powered by Gemini) that analyzes your data and suggests improvements
- On-premise deployment option with LDAP/SSO for enterprise security requirements
Day-by-Day Checklist
Here's your complete checklist:
| Day | Task | Output |
|---|---|---|
| 1 | Define metrics precisely | Shared document with metric definitions |
| 2 | Choose tooling | Tool selected, access requested |
| 3 | Connect data sources | Data flowing into dashboard |
| 4 | Calculate baseline | Table with 4 metrics + DORA levels |
| 5 | Present to team | Team alignment, concerns addressed |
| 6–7 | Deep dive into weakest metric | Root cause analysis |
| 8 | Set first target | One specific, time-bound goal |
| 9 | Establish review cadence | Weekly review on team calendar |
| 10 | Start first improvement sprint | One concrete action in progress |
After Day 10, you have: live DORA metrics, a baseline, a target, and an active improvement. That's more than most teams achieve in a quarter.
"As a CTO and for our tech leads, it's important to see not individual employees but the state of the development process: where it's efficient and where it breaks down. The product allows natively collecting metrics right from the IDE, without feeling controlled or surveilled. Implementation was very simple." — Maksim Popov, CTO ABR Tech (Forbes Kazakhstan, April 2026)
Benchmarks from the DORA State of DevOps Reports (2019–2023), published by Google Cloud / DORA team.
Ready to set up DORA metrics in under an hour? PanDev Metrics connects to your Git provider, breaks Lead Time into 4 stages, and gives you a live DORA dashboard — no spreadsheets, no custom scripts. Start your 2-week implementation →