IoT Embedded Engineering: Metrics for Firmware Teams

A team shipping a battery-powered agricultural sensor runs a CI pipeline that takes 38 minutes to build a firmware image, flash it to hardware-in-the-loop, run a 12-minute on-device test suite, and publish artifacts. Their web-app teammates push to main and see green checks in 7 minutes. When both teams get measured on deployment frequency, the firmware team looks like they're underperforming by 5×. They're not. They're doing harder work with a longer feedback loop, and the metric isn't reading it.
Most engineering metrics were built for web software: fast builds, reversible deploys, observability from day one. IoT and embedded teams inherit these metrics and look bad against them. The DORA framework acknowledges this explicitly — the 2023 Accelerate State of DevOps report noted that "teams shipping embedded or regulated software face a different distribution and should not be compared to web teams on deployment frequency alone". This article is what you track instead.
{/* truncate */}
Why IoT engineering is different
Three constraints reshape the measurement problem:
1. The feedback loop includes physical hardware. A firmware change that boots on the simulator might brick the device. Every CI has a hardware-in-the-loop (HIL) stage, or it's not catching real bugs. HIL is slow and expensive to parallelize.
2. Deploys are one-way. Over-the-air (OTA) updates to a million devices in the field are irreversible in practice. You can push a rollback firmware, but the device has to accept it, have battery, have connectivity. A bricked device is truly bricked. The cost-of-change-failure curve is exponential, not linear.
3. The code runs on resource-constrained targets. RAM measured in KB, flash in MB, power budgets in microamps. "Performance regression" means a commit that works in tests but drains a battery from 12 months to 8 months — a bug that CI can't catch without long-duration testing.
IEEE's 2024 Embedded Systems Week proceedings (Balsini et al., "CI for safety-critical firmware") reported that embedded teams spend 34% more engineering time on test infrastructure than their web counterparts for equivalent feature-delivery velocity. That's not a productivity gap — it's a structural tax on the work.
The metrics that matter for firmware teams
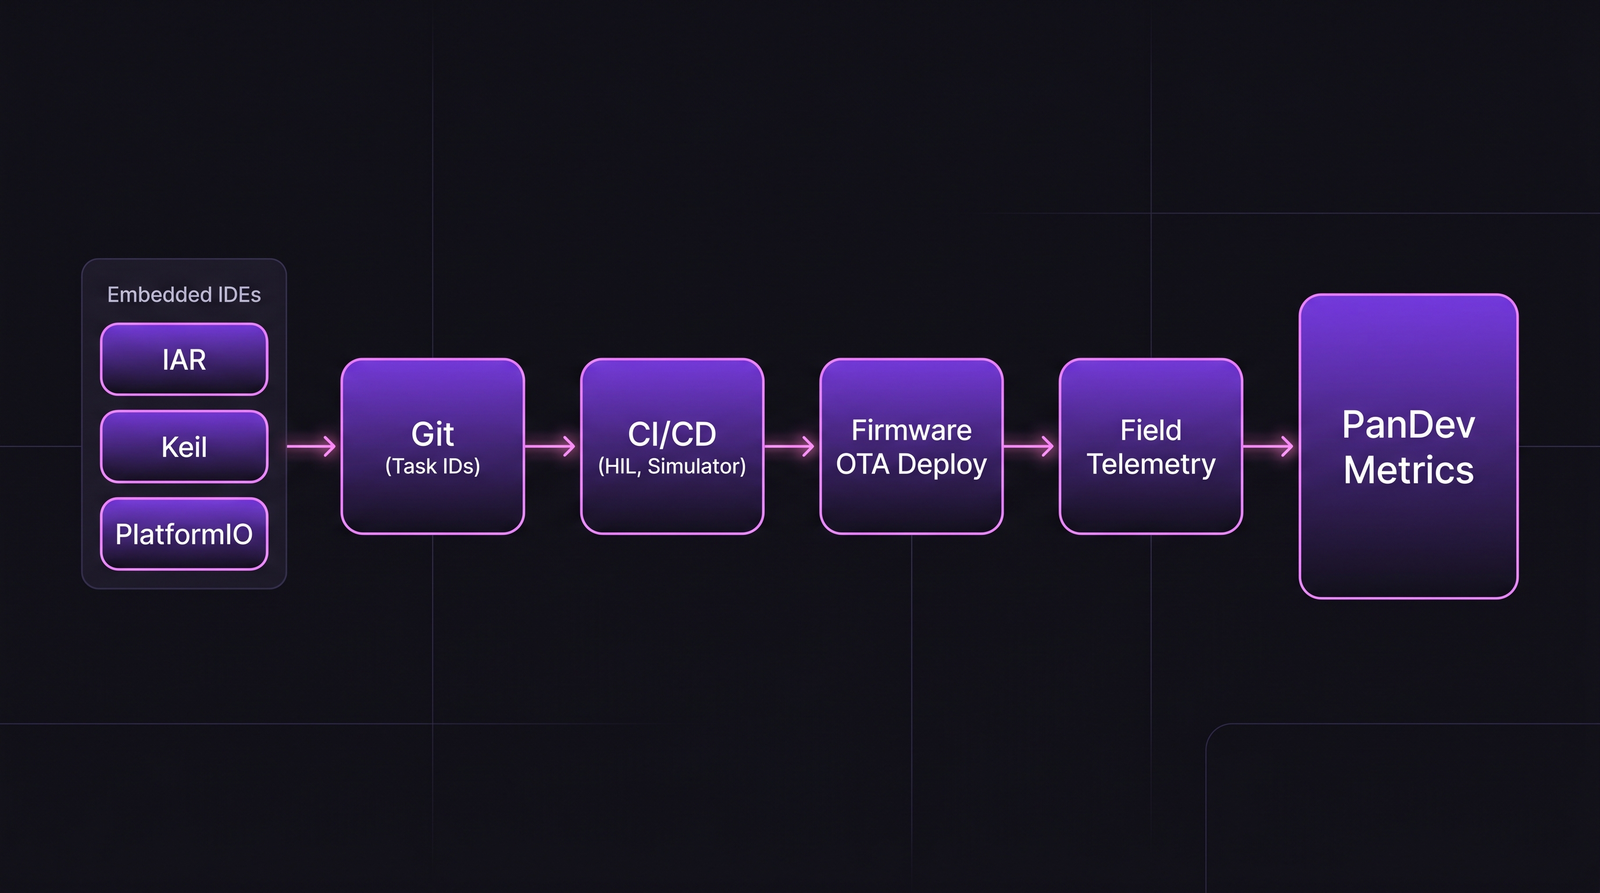 The firmware delivery chain. Notice what's absent from most engineering dashboards: the simulator-to-HIL handoff and the field-telemetry loop.
1. Build + HIL cycle time
Not just build time. Build + flash + HIL smoke test. That's what blocks a PR from merging.
| Target range | What it says |
|---|---|
| <15 min | Healthy for small firmware (sensor nodes, wearables) |
| 15-40 min | Typical for mid-size firmware (industrial IoT, vehicle ECUs) |
| 40-90 min | Acceptable for large codebases (automotive, complex controllers) |
| >90 min | Engineers start batching PRs or skipping CI — danger zone |
At >90 minutes, engineers context-switch off the task, lose state, and the HIL queue forms a daily bottleneck that shapes the entire team's rhythm. One of our customers building vehicle telematics firmware tracked this obsessively and cut HIL queue time from 4.2 hours median to 45 minutes by parallelizing HIL test benches — their throughput of firmware releases went up 2.4× in the same quarter.
2. Simulator-to-HIL divergence rate
Percent of commits that pass simulator tests but fail HIL (or vice versa). High divergence means either the simulator is lying, or HIL is catching intermittent hardware issues — both are fixable, both require attention.
Healthy range: <8%. Above 15%, the simulator is not useful as a gate.
3. OTA deploy success rate
OTA updates fail for reasons web deploys never see: battery dies mid-update, radio loses signal, brownout reboots, bootloader state corruption. A mature IoT team tracks OTA success across device cohorts.
| Cohort type | Acceptable OTA success rate |
|---|---|
| Always-powered devices (consumer hub, gateway) | 99.0%+ |
| Battery-powered, always-on (wearable, sensor) | 97.5%+ |
| Low-power, intermittent (asset tracker, AMR) | 94%+ |
| Low-power + adversarial RF (agriculture, mining) | 88%+ |
Anything below the cohort baseline means you have a real fleet-management problem, not a firmware bug.
4. Field-detected vs pre-release defect ratio
For firmware, the cost asymmetry between "caught in CI" and "caught in the field" is dramatic. A bug shipped to 40k devices requires an OTA, a support ticket storm, and possibly a recall.
Track: for every firmware defect found and fixed, was it caught in CI/HIL, in beta, in production? Healthy mature teams sit at 85%+ caught pre-release. Teams below 70% are under-investing in HIL coverage.
5. Power/memory regression frequency
A commit that adds 2KB to binary size is fine in web. In embedded, it can be catastrophic — your next chip revision might not have that flash. Same for power draw: a 50 microamp regression on a sensor expected to run 3 years on a coin cell is a product failure.
Track on every CI build: binary size delta, peak RAM delta, average power draw delta (where power can be measured on HIL). Flag any regression > 2% with a named owner.
6. Debug session duration
This is where embedded pain shows up most clearly. Web engineers iterate in seconds. Embedded engineers set breakpoints, attach JTAG, step through hardware state. A single debug session can last hours.
Microsoft Research's 2022 study of embedded developer workflows (Kaur et al.) found median debug session length in firmware was 3.5× longer than in web. This isn't fixable, but it is measurable — and if debug sessions suddenly double in duration, something changed: tooling broke, new hire is stuck, or the codebase hit a complexity threshold.
Tool and integration reality
Firmware teams don't live in VS Code most of the time. The IDE landscape:
| Tool | Adoption pattern | Notable |
|---|---|---|
| Keil MDK (ARM) | Legacy automotive, medical | Proprietary, slow to modernize |
| IAR Embedded Workbench | Safety-critical (DO-178C, ISO 26262) | Expensive, certified toolchain |
| PlatformIO | Maker-to-enterprise migration | Cross-platform, VS Code integration |
| STM32CubeIDE | STM32-specific, huge ecosystem | Free, Eclipse-based |
| Zephyr + VS Code | Modern embedded, RTOS | West tool, growing fast |
| Arduino IDE | Prototypes, education | Not a production tool |
PanDev Metrics' IDE heartbeat plugins cover JetBrains, VS Code, Eclipse (which includes STM32CubeIDE), and Visual Studio. Keil and IAR don't have plugins — for those toolchains, we rely on Git signals alone, which reduces the fidelity of time-on-task measurement. This is a gap we're honest about: if your team lives in IAR, our IDE-side telemetry covers the VS Code portion of your stack, not the Keil/IAR sessions. We see what's in Git.
The compliance layer (for safety-critical)
For ISO 26262 (automotive), IEC 62304 (medical), DO-178C (aerospace), and IEC 61508 (industrial), the metric that matters is requirements traceability: every code change must map to a requirement, a test, and a verification artifact.
This changes the entire measurement model. Delivery velocity is constrained by audit cadence, not by team capability. Teams in these domains typically ship major firmware releases 2-4 times per year, with continuous patch releases. Comparing their deployment frequency to a cloud SaaS is meaningless — a useful comparison is against peer teams in the same compliance regime.
Team health signals specific to firmware
Firmware teams have their own burnout patterns. Three we see more than in web:
1. Lab-hours creep. An engineer who's suddenly spending 70% of their time in the lab (vs typical 30-40%) is either debugging a bad bug or covering for hardware team delays. Neither is sustainable.
2. "One person owns the bootloader" risk. Almost every embedded team has a single engineer who understands the full boot sequence. If they leave, release velocity craters. Track: does every critical subsystem have a backup owner who's committed code there in the last 90 days?
3. Certification-prep sprint fatigue. Before audits, teams hit 60-70 hour weeks. We see burnout signals (after-hours commits, weekend work, vacation-gap hours) spike 3× during cert windows. Planning around it is the only fix.
Where PanDev Metrics fits for firmware teams
Our IDE heartbeat captures the VS Code, JetBrains, Eclipse, and Visual Studio portion of firmware work. Git integration captures the full picture of what shipped. Where we have less signal: proprietary toolchains (IAR, Keil) and physical lab time not spent in an editor. Teams using PanDev Metrics in firmware contexts typically pair IDE telemetry with git-commit patterns to estimate true time-on-task — accurate enough for utilization and cost-per-feature calculations, imperfect for fine-grained focus-time analysis.
The contrarian claim
Deployment frequency as a headline metric is misleading for firmware teams. What actually predicts firmware quality is HIL coverage growth rate — how fast the team is extending hardware-in-the-loop testing to new code paths. A team that ships weekly but has stagnant HIL coverage is building up field-defect debt. A team that ships quarterly but is continuously expanding HIL is safer.
Honest limit: our dataset has roughly 30 firmware-adjacent customers. That's enough to see patterns but not enough to make statistically confident claims about industry benchmarks. Treat the ranges in this article as working hypotheses informed by our sample plus published embedded-systems research — they'll move as we collect more data.
Related reading
- MedTech: Engineering Metrics in a Regulated Environment
- DORA Metrics: The Complete Guide for Engineering Leaders
- MTTR: Why Speed of Recovery Matters More Than Preventing All Failures
If your firmware team is being measured on web-team metrics, the problem isn't the team's performance — it's the measurement frame.