IT Budget Planning With Data, Not Guesswork

It's budget season. The CTO submits an engineering budget request: $8.2M for next year, up 18% from this year. The CFO asks for justification. The CTO points to headcount growth, salary inflation, and a list of planned projects. The CFO pushes back: "Can we do it for $7M?" The CTO says no. They compromise at $7.5M.
Neither number is based on data. The CTO added a buffer to last year's spend. The CFO cut it by a round number. The compromise has no analytical basis. Both sides walk away slightly unhappy. A Deloitte CFO Survey found that technology spending is consistently one of the hardest budget categories for finance teams to evaluate — largely because the inputs are opaque.
This is how most IT budgets are built. It doesn't have to be.
{/* truncate */}
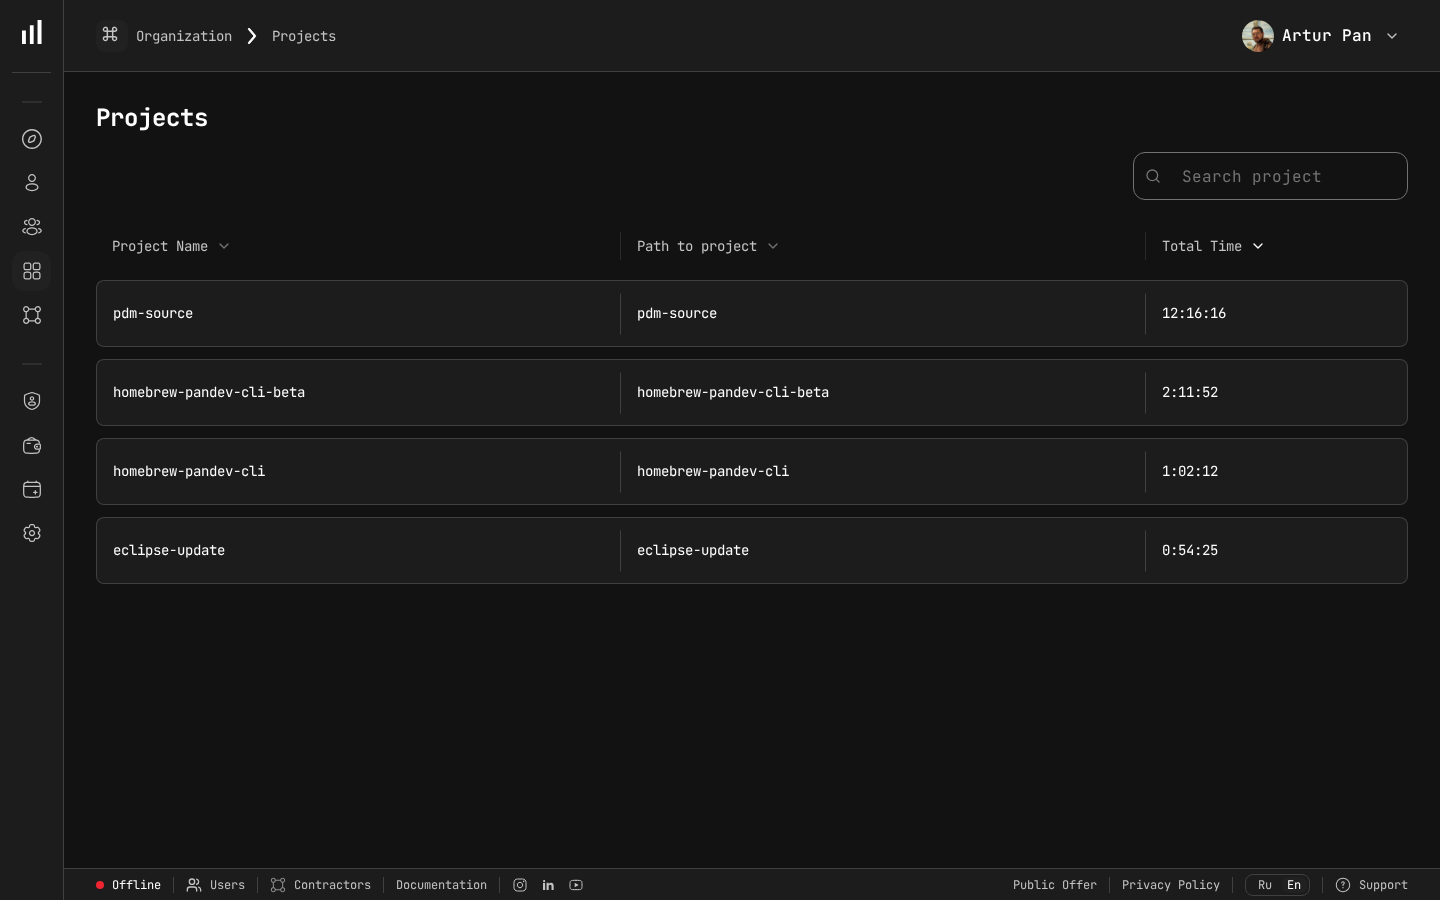
Projects with tracked time — the data foundation for engineering budgets.
The Problem with Traditional IT Budgeting
Most engineering budgets are built using one of two methods:
Method 1: Last Year Plus Inflation Take last year's spend, add 10-20% for growth and salary inflation, submit. This is fast but ignores changes in project scope, team composition, and efficiency.
Method 2: Headcount-Based Multiply planned headcount by average cost per head, add infrastructure and tooling. This captures team size but treats all developers as interchangeable units with identical output.
Both methods share the same fundamental flaw: they budget for inputs (people, infrastructure) without connecting to outputs (features, products, business outcomes). Gartner's IT spending forecasts project continued growth in technology budgets, which makes the lack of output-based justification even more consequential.
The result? Engineering budgets that are disconnected from business strategy, difficult to justify to the board, and impossible to hold accountable mid-year.
A Data-Driven Budgeting Framework
Here's an alternative approach that connects engineering spend to business outcomes. It requires historical data, which is why tracking engineering costs throughout the year (not just at budget time) is essential.
Step 1: Understand Historical Cost Patterns
Before projecting forward, look back. You need to know how last year's budget was actually spent.
Historical cost breakdown example:
| Category | Planned | Actual | Variance |
|---|---|---|---|
| New feature development | $2,800,000 | $2,340,000 | -16% |
| Maintenance and reliability | $1,200,000 | $1,680,000 | +40% |
| Technical debt / platform | $800,000 | $620,000 | -22% |
| Support and incidents | $400,000 | $580,000 | +45% |
| Infrastructure (cloud) | $600,000 | $720,000 | +20% |
| Tooling and licenses | $200,000 | $190,000 | -5% |
| Total | $6,000,000 | $6,130,000 | +2.2% |
Several things stand out in this example:
- Maintenance was 40% over budget — either the estimate was too low or the systems are more fragile than expected
- New features came in 16% under — either the team was more efficient or (more likely) features were deprioritized to handle maintenance and support overflow
- Support and incidents were 45% over — unplanned work consumed planned capacity
These patterns repeat year after year in most organizations. If you budget the same way again, you'll get the same variances.
Step 2: Calculate Unit Costs
Turn historical data into unit economics that can be projected forward.
Key unit costs to calculate:
Cost per feature point = Total feature development cost / Total feature points delivered
Cost per deployment = Total delivery cost / Number of deployments
Cost per supported customer = Total support/incident cost / Number of customers
Infrastructure cost per user = Total cloud spend / Active users
Maintenance cost per service = Total maintenance cost / Number of production services
Example unit costs:
| Unit Cost | This Year | Last Year | Trend |
|---|---|---|---|
| Cost per feature point | $4,200 | $4,800 | ↓ 12.5% (improving) |
| Cost per deployment | $1,100 | $1,450 | ↓ 24% (improving) |
| Cost per customer (support) | $48 | $42 | ↑ 14% (worsening) |
| Infrastructure per user | $3.20 | $2.80 | ↑ 14% (worsening) |
| Maintenance per service | $32,000 | $28,000 | ↑ 14% (worsening) |
Now you can have specific conversations: "Our maintenance cost per service is growing 14% per year. With 5 new services planned, that's an additional $160K in maintenance budget."
Step 3: Build the Budget Bottom-Up
Instead of starting with headcount, start with planned output and work backward to required investment.
The formula:
Required Budget = Σ (Planned_Output_i × Unit_Cost_i) × (1 + Risk_Buffer)
Budget model example:
| Budget Line | Calculation | Amount |
|---|---|---|
| New features | 180 feature points × $4,000/point | $720,000 |
| Platform improvements | 3 major initiatives × $85,000 avg | $255,000 |
| Maintenance | 57 services × $33,000/service | $1,881,000 |
| Support capacity | 15,000 customers × $50/customer | $750,000 |
| Infrastructure | 45,000 users × $3.40/user | $153,000 |
| Tooling | 42 engineers × $4,800/engineer | $201,600 |
| Subtotal | $3,960,600 | |
| Risk buffer (10%) | $396,060 | |
| Total budget | $4,356,660 |
Then convert back to headcount to validate:
Required headcount = Budget / Average loaded cost per engineer
$4,356,660 / $195,000 = ~22 engineers
If you currently have 20 engineers, you need 2 more hires. If you have 25, you have capacity to spare (or can invest in tech debt reduction, training, etc.).
Step 4: Tie Budget to Business Outcomes
The budget request should explicitly connect to revenue targets. This is what the board wants to see.
Budget-to-revenue mapping:
| Budget Category | Investment | Expected Business Outcome |
|---|---|---|
| New features | $720,000 | Enable $3.2M in new ARR pipeline |
| Platform improvements | $255,000 | Reduce churn by 8% ($440K ARR saved) |
| Maintenance | $1,881,000 | Maintain 99.9% uptime for $18M ARR base |
| Support capacity | $750,000 | Handle 25% customer growth |
Now the CFO can evaluate engineering spend as an investment portfolio, not a cost center.
Step 5: Define Checkpoints and Reforecast Triggers
A budget is a plan. Plans change. Build in quarterly checkpoints and define what triggers a reforecast.
Reforecast triggers:
- Unit costs deviate more than 15% from projections for two consecutive months
- Planned headcount changes by more than 10%
- A major unplanned project is added (e.g., security incident remediation, acquisition integration)
- Revenue targets change by more than 20%, requiring adjusted engineering investment
The Budget Presentation: What CFOs Want to See
Page 1: Executive Summary
Requested FY2027 Engineering Budget: $4.36M (+12% vs FY2026)

Key investments:
- Feature development supporting $3.2M ARR pipeline
- Platform reliability maintaining $18M ARR base
- Scaling support for 25% customer growth

Efficiency improvement: Cost per feature point down 12.5% YoY
ROI: $21.6M revenue supported by $4.36M engineering investment (5:1)
Page 2: Historical Performance
Show that last year's budget was spent responsibly and that the team is becoming more efficient.
| Metric | FY2025 | FY2026 | FY2027 Target |
|---|---|---|---|
| Total engineering spend | $5.4M | $6.1M | $4.4M |
| Revenue supported | $14M | $18M | $23.4M |
| Revenue per eng dollar | $2.59 | $2.95 | $5.36 |
| Cost per feature point | $4,800 | $4,200 | $4,000 |
| Engineers | 35 | 42 | 22 |
Page 3: Budget Breakdown by Category
Show where every dollar goes and why. Use the output-based model from Step 3.
Page 4: Risk Analysis
| Risk | Probability | Budget Impact | Mitigation |
|---|---|---|---|
| Higher-than-expected maintenance | 40% | +$200K | Invest in automated testing (already budgeted) |
| Key hire delays | 30% | -$100K (underspend) | Contractor backfill budgeted in risk buffer |
| Cloud cost overrun | 25% | +$75K | Reserved instances negotiation in progress |
| Major security incident | 10% | +$300K | Covered by risk buffer + insurance |
Page 5: Quarterly Milestones
| Quarter | Planned Spend | Key Deliverables | Revenue Impact |
|---|---|---|---|
| Q1 | $1.05M | Enterprise SSO, API v3 | $800K pipeline |
| Q2 | $1.10M | Mobile app, Advanced Analytics | $1.2M pipeline |
| Q3 | $1.10M | Platform migration, Scale infra | $600K saved (churn) |
| Q4 | $1.06M | AI features, 2028 planning | $600K pipeline |
Common Budgeting Mistakes
Mistake 1: Budgeting for Capacity, Not Output
"We need 5 more engineers" is a capacity request. "We need $720K to deliver 180 feature points supporting $3.2M in pipeline" is an investment case. The second one gets approved.
Mistake 2: Treating Infrastructure as Fixed
Cloud costs are variable and often grow faster than revenue. Budget cloud infrastructure per user or per transaction, not as a fixed line item. Re-evaluate quarterly.
Mistake 3: Zero Budget for Technical Debt
If you don't explicitly budget for tech debt reduction, it won't happen. Then maintenance costs grow 10-15% per year until something breaks. Budget 15-20% of engineering capacity for platform health.
Mistake 4: Ignoring the Cost of Context Switching
When engineers are split across too many projects, their effective output drops significantly — research on multitasking in knowledge work puts the penalty at 20% or more per additional concurrent project. A budget that plans for 42 engineers working at 100% efficiency across 12 projects is fiction. Plan for 70-80% effective capacity.
Mistake 5: Annual Budget with No Mid-Year Adjustment
The technology landscape changes faster than an annual budget cycle. Build in quarterly reforecast points and define clear triggers for budget adjustments.
The Data Foundation: What You Need to Track Year-Round
Data-driven budgeting requires year-round data collection, not a scramble in Q4. Here's what to track continuously:
| Data Point | Source | Update Frequency |
|---|---|---|
| Developer time per project | Automated IDE tracking | Real-time |
| Loaded hourly rates | HR / Finance | Quarterly |
| Feature points delivered | Project management tool | Per sprint |
| Deployment frequency | CI/CD pipeline | Real-time |
| Cloud infrastructure costs | Cloud provider billing | Monthly |
| Incident volume and resolution time | Incident management tool | Real-time |
| Customer count and growth | CRM / billing system | Monthly |
How PanDev Metrics Provides the Data Foundation
Building a data-driven IT budget requires continuous tracking of engineering costs and output. PanDev Metrics provides the essential data layer:
- Automated activity tracking via 10+ IDE plugins — accurate time-per-project data without manual logging
- Financial analytics with hourly rates — calculate cost per project, per team, per feature automatically
- Historical trend data — unit costs, efficiency metrics, and allocation patterns over time
- Project-level cost reporting — see exactly how budget is being spent against plan
- Multi-provider git support — track work across GitHub, GitLab, Bitbucket, and self-hosted repos
- On-premise deployment — budget data, salary information, and project costs stay within your infrastructure
- AI assistant — generates insights, anomaly detection, and forecasting from your historical data
The companies that build the best budgets are the ones that track engineering costs all year, not just during budget season.
Key Takeaways
- Budget for outputs, not inputs — connect engineering spend to features, products, and business outcomes
- Calculate unit costs — cost per feature point, per deployment, per customer enables bottom-up budgeting
- Use historical data — last year's actuals (not last year's plan) should drive next year's projections
- Tie budget to revenue — every engineering investment should map to a revenue outcome or risk mitigation
- Build in checkpoints — quarterly reforecasts keep the budget relevant as conditions change
- Track costs year-round — data-driven budgeting requires continuous data collection, not a Q4 sprint
Want to build your next IT budget on real data? PanDev Metrics provides automated cost tracking, financial analytics, and the historical data you need for bottom-up budgeting.