How to Justify Hiring 5 More Developers to Your CFO

Stripe's "Developer Coefficient" report estimated that companies worldwide lose over $300 billion annually due to developer inefficiency — much of it from understaffed teams fighting technical debt instead of shipping features. You need more engineers. Your team is overloaded, deadlines are slipping, and technical debt is piling up. You know this intuitively. But your CFO doesn't care about your intuition — they care about numbers, ROI, and risk. The reason most headcount requests fail isn't that they're wrong. It's that they're argued in the wrong language.
{/* truncate */}
Why "We're Overwhelmed" Doesn't Work
Here's what the CFO hears when you say "we need 5 more developers":
- You hear: "My team is at breaking point and we can't deliver the roadmap"
- CFO hears: "I can't manage my team's capacity and I want to throw money at the problem"
It's not fair, but it's reality. CFOs are trained to be skeptical of headcount requests because:
- Engineering is already the biggest cost center. Developers are expensive. A CFO sees a $150K+ fully loaded cost per engineer and wants hard evidence before approving five more.
- They can't verify your claims. When you say "we're at capacity," the CFO has no way to validate that. Are you really at capacity, or is there waste?
- Headcount is a permanent commitment. Unlike a software license you can cancel, hiring someone is a long-term financial obligation.
To win the headcount argument, you need to build a business case that addresses all three concerns with data.
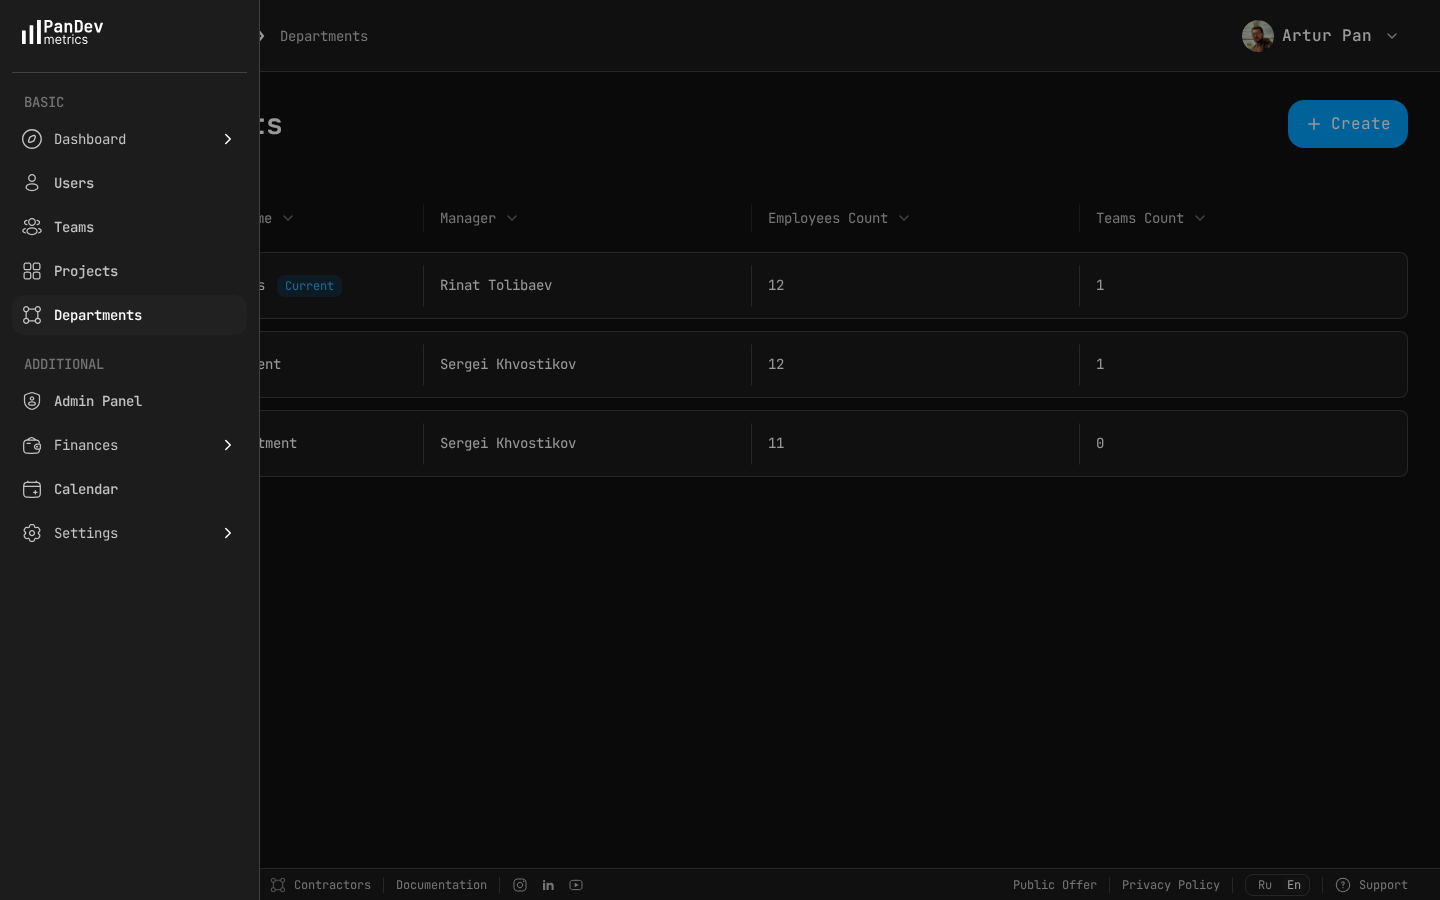 The Departments view lets you break down headcount by team — giving the CFO a clear picture of where people are allocated and why you need more.
Step 1: Prove Current Capacity Is Maxed
Before asking for more people, you need to prove that your current team is running at full capacity — and that this capacity is well-utilized.
The Data You Need
| Metric | What It Shows | CFO Translation |
|---|---|---|
| Activity Time per developer | Hours of actual coding work per day | "Our developers are already working at maximum productive output" |
| Focus Time | Uninterrupted deep work blocks | "We've already optimized their environment — there's no hidden slack" |
| Utilization rate | % of available time spent on productive work | "We're running at X% utilization, above the sustainable threshold" |
| Overtime indicators | Work outside business hours | "People are already working beyond normal hours to keep up" |
How to Present It
"Our team of 20 developers currently averages 5.2 hours of productive work per day, with Focus Time of 2.8 hours. Industry benchmarks suggest this is in the 85th percentile for engineering productivity. We've already optimized meeting load and tooling — there's minimal slack left to capture."
This preempts the CFO's first objection: "Can't you just make the current team more efficient?"
Key principle: You're not saying "we work hard." You're saying "we've already optimized, and here's the data to prove it."
Step 2: Quantify the Cost of Not Hiring
This is where most CTOs fail. They talk about what they could do with more people. CFOs care more about what it costs to not have them.
Revenue at Risk
Calculate the revenue impact of delayed features:
Feature: Enterprise SSO Integration
Blocked deals waiting for SSO: 8
Average deal size: $85,000 ARR
Expected close rate with SSO: 60%
Revenue at risk: 8 × $85,000 × 0.60 = $408,000 ARR

Current timeline without new hires: Q4 2026
Timeline with 2 additional engineers: Q2 2026
Revenue acceleration: 6 months × $408,000/12 = $204,000
Technical Debt Cost
Quantify what technical debt is costing you right now:
Incident frequency (last quarter): 14 production incidents
Average incident cost:
  - Engineer time per incident: 6 hours × 3 engineers = 18 hours
  - Fully loaded hourly cost: $95/hour
  - Cost per incident: $1,710
  - Customer impact/compensation: ~$3,000 average
Quarterly incident cost: 14 × ($1,710 + $3,000) = $65,940

Root cause: 9 of 14 incidents (64%) traced to legacy payment
system that requires dedicated refactoring effort.

Cost to fix: 2 engineers × 3 months = ~$95,000
Annual savings after fix: ~$190,000 (reduced incidents)
ROI: 100% in first year
Opportunity Cost of Delayed Roadmap
Map out the roadmap items being deferred and their expected impact:
| Feature | Expected Impact | Current Delay | Cost of Delay |
|---|---|---|---|
| Enterprise SSO | $408K ARR pipeline | 6 months | $204K delayed revenue |
| API v2 | 40% reduction in support tickets | 4 months | $32K in support costs |
| Mobile app | Access to new market segment | 8 months | $500K estimated first-year revenue |
| Performance overhaul | 25% reduction in infrastructure costs | 6 months | $90K in excess AWS spend |
Total annual cost of not hiring: $826K
Compare this to the cost of 5 developers:
5 developers × $150K fully loaded = $750K/year
Net benefit in year 1: $826K - $750K = $76K positive
Net benefit in year 2+: $826K (ongoing savings/revenue)
Step 3: Show the Hiring Plan, Not Just the Number
CFOs hate vague requests. "We need about 5 engineers" sounds like a guess. A detailed plan shows rigor.
Headcount Allocation Plan
| Role | Team | Primary Project | Expected Impact | Start Date |
|---|---|---|---|---|
| Senior Backend | Platform | Payment system refactor | Reduce incidents by 64% | Q2 2026 |
| Senior Backend | Platform | API v2 | Reduce support tickets by 40% | Q2 2026 |
| Mid Frontend | Product | Enterprise SSO | Unblock $408K pipeline | Q2 2026 |
| Mid Full-stack | Product | Mobile app | New revenue channel | Q3 2026 |
| DevOps/SRE | Infrastructure | Performance & reliability | Cut infra costs by 25% | Q2 2026 |
Ramp-Up Timeline
Show you've thought about the reality that new hires aren't productive on day one:
| Month | Productivity Level | Effective Capacity Added |
|---|---|---|
| Month 1 | 10% (onboarding) | 0.5 FTE |
| Month 2 | 40% (ramping) | 2.0 FTE |
| Month 3 | 70% (contributing) | 3.5 FTE |
| Month 4 | 85% (independent) | 4.25 FTE |
| Month 6+ | 100% (full capacity) | 5.0 FTE |
This shows the CFO that you understand the investment curve and aren't promising instant results.
Total Cost Breakdown
Don't make the CFO guess — provide the full picture:
| Cost Category | Per Developer | Total (5 devs) |
|---|---|---|
| Base salary | $120,000 | $600,000 |
| Benefits & taxes (25%) | $30,000 | $150,000 |
| Equipment & tooling | $5,000 | $25,000 |
| Recruiting (20% of salary) | $24,000 | $120,000 |
| Onboarding (reduced productivity) | $15,000 | $75,000 |
| Total Year 1 | $194,000 | $970,000 |
| Total Year 2+ | $155,000 | $775,000 |
Year 1 ROI: ($826K benefit - $970K cost) = -$144K (investment year) Year 2 ROI: ($826K benefit - $775K cost) = +$51K net positive, plus compound effects
Be honest about year 1 being an investment. CFOs respect honesty more than inflated projections.
Step 4: Address the Alternatives
A smart CFO will ask: "Have you considered alternatives to hiring?" Have answers ready.
Alternative 1: Outsourcing / Contractors
| Factor | Full-time Hire | Contractor |
|---|---|---|
| Hourly cost | ~$75 (fully loaded) | ~$120-180 |
| Ramp-up time | 3-4 months | 2-3 months |
| Knowledge retention | Permanent | Lost when contract ends |
| Cultural fit | Develops over time | Limited |
| Best for | Core product work | Short-term, defined projects |
Your answer: "For the payment system refactor and SSO — core, long-term product work — full-time hires are more cost-effective. I'd consider contractors for the mobile app prototype as a time-boxed project."
According to Forbes Kazakhstan, switching to hourly tracking based on real activity data can reduce labor costs by 25-30% — making data-driven capacity planning essential before requesting new headcount. — Forbes Kazakhstan, April 2026
Alternative 2: Reduce Scope
Your answer: "Here's the roadmap with reduced scope. These are the features we'd cut and their revenue impact: [table]. The board approved this roadmap — cutting these items means revising revenue projections."
Alternative 3: Improve Current Team Productivity
Your answer: "We've already done this. Here's the data showing our productivity improvements over the past 6 months: [Activity Time increased 15%, Focus Time increased 22%, PR cycle time decreased 35%]. We're past the point of optimization gains."
This is where having historical engineering metrics is powerful. McKinsey's research on developer productivity confirms that even high-performing teams reach an optimization ceiling — after which adding capacity is the only way to increase output. If you can show a trend of improving efficiency, it's proof that you've already tried the "do more with less" approach and hit that ceiling.
Step 5: Present the Risk Scenario
CFOs think in terms of risk. Give them a risk matrix:
If We Hire (5 developers)
| Risk | Probability | Impact | Mitigation |
|---|---|---|---|
| Hires underperform | Medium | Medium | 90-day performance check with data |
| Revenue projections miss | Low | High | Conservative 70% realization factor already applied |
| Team integration issues | Low | Low | Structured onboarding; team-specific mentors |
If We Don't Hire
| Risk | Probability | Impact | Mitigation |
|---|---|---|---|
| Key developers leave (burnout) | High | Critical | None — replacing them costs more than hiring new |
| Roadmap delays compound | High | High | None — already operating at capacity |
| Competitors ship first | Medium | Critical | None — can't accelerate without capacity |
| Technical debt incidents increase | High | High | Reactive patching only (more expensive) |
The attrition argument is your strongest card. Industry research, including data from the Society for Human Resource Management (SHRM), estimates the replacement cost for a senior technical role at 1.5-2x their annual salary — covering recruiting, ramp-up, and lost productivity. If you lose 2 seniors because you didn't hire 5 juniors/mids, the CFO has a much bigger problem.
The One-Page Executive Summary
After building the full business case, distill it into a one-page summary for the CFO meeting. This is what they'll actually read:
ENGINEERING HEADCOUNT REQUEST — Q2 2026
Requested: 5 engineers (2 Senior BE, 1 Mid FE, 1 Mid FS, 1 SRE)

CURRENT STATE:
- Team of 20, operating at 85th percentile productivity
- 6 months of optimization already captured
- Key roadmap items delayed 4-8 months

BUSINESS IMPACT (ANNUAL):
- Revenue at risk from delays: $612K
- Technical debt cost: $264K
- Infrastructure waste: $90K
- Total cost of inaction: $826K/year

INVESTMENT:
- Year 1 cost: $970K (includes recruiting + ramp-up)
- Year 2+ cost: $775K
- Payback period: 14 months

ALTERNATIVES CONSIDERED:
- Contractors: More expensive for core work ($120-180/hr vs. $75)
- Scope reduction: Requires board approval; $612K revenue impact
- Further optimization: Data shows diminishing returns

RISK IF WE DON'T HIRE:
- 40% probability of losing 2+ senior developers to burnout
- Replacement cost per senior: $225K-300K
- Roadmap delays compound; competitor risk increases
The Presentation Tips
A few tactical tips for the actual CFO conversation:
- Lead with the cost of inaction, not the cost of hiring. "$826K at risk" lands harder than "$970K investment needed."
- Bring the data, not slides full of text. Show the engineering metrics dashboard. Let the CFO see that these are real measurements, not estimates.
- Offer a phased approach. "If 5 is too many at once, let's start with 3 in Q2 and 2 in Q3. Here's how the impact changes..."
- Show you track ROI. "After hiring, I'll measure the impact on delivery speed, incident rate, and revenue acceleration quarterly." This signals accountability.
- Know your numbers cold. The CFO will drill into specifics. If you can't answer "what's the fully loaded cost per engineer including overhead?" without hesitating, you'll lose credibility.
After Approval: Close the Loop
If you get the headcount, your job isn't done. Track and report the results:
- Month 3: Ramp-up progress per new hire (use Activity Time and Delivery Index)
- Month 6: First delivery milestones hit
- Quarter 2: Revenue impact of unblocked features
- Year 1: Full ROI analysis vs. business case projections
This builds credibility for future requests. A CTO who says "last year I asked for 5 engineers, projected $826K in value, and we delivered $910K" will get their next headcount request approved much faster.
Build the business case that wins approval. PanDev Metrics gives you the capacity data, cost analytics, and productivity trends you need to speak the CFO's language. Show real utilization numbers, track cost per project and per team, and prove ROI after every hire.