How to Measure Lead Time for Changes: The 4-Stage Breakdown That Reveals Your Real Bottlenecks

Stripe's 2018 "Developer Coefficient" study estimated that $300 billion is lost globally each year to developer inefficiency. A large share of that waste hides inside a single metric: Lead Time. A Lead Time of 5 days tells you nothing. Is it 4 days of coding and 1 day of review? Or 1 day of coding and 4 days waiting for someone to open your merge request? The fix for each scenario is completely different — and if you're treating Lead Time as a single number, you're solving the wrong problem.
{/* truncate */}
Why a Single Lead Time Number Is Useless
The DORA research program defines Lead Time for Changes as the time from first commit to code running in production. The 2023 State of DevOps Report sets the benchmarks:
| Performance Level | Lead Time |
|---|---|
| Elite | Less than 1 hour |
| High | Between 1 day and 1 week |
| Medium | Between 1 week and 1 month |
| Low | More than 1 month |
These benchmarks are useful for positioning your team on the industry curve. They are useless for figuring out what to fix. If your Lead Time is 12 days, the aggregate number doesn't tell you whether to invest in CI/CD automation, code review processes, or developer tooling.
You need decomposition.
The 4 Stages of Lead Time
At PanDev Metrics, we break Lead Time into four sequential stages. Each stage represents a distinct phase with distinct owners, distinct causes of delay, and distinct interventions.
Stage 1: Coding Time
Definition: From the first commit on a branch to the moment a merge request (or pull request) is created.
What it captures: The time a developer spends writing, testing locally, and preparing the change for review. This includes IDE time, local debugging, and writing test coverage.
Healthy range: 1–3 days for a typical feature. Anything over 5 days often signals scope creep, unclear requirements, or a developer stuck without help.
Common antipatterns:
- Developers batch multiple unrelated changes into one MR because the review process is painful
- No work-in-progress limits, so developers context-switch between 3–4 features
- Requirements are ambiguous, leading to rework before the MR is even opened
What to fix:
- Break work into smaller tickets (aim for MRs under 400 lines of diff)
- Track IDE activity with heartbeat data to distinguish "actively coding" from "branch sits idle"
- Pair unclear tickets with a short design review before coding starts
Stage 2: Pickup Time
Definition: From when the merge request is created to the first meaningful review action (comment, approval, or request for changes).
What it captures: How long code sits waiting for someone to start reviewing it. This is pure queue time — no value is being added.
Healthy range: Under 4 hours during business hours. Over 24 hours is a red flag.
Why this stage matters most: Our platform data across B2B engineering teams consistently shows Pickup Time as the #1 hidden bottleneck — a pattern that mirrors findings in the GitHub Octoverse reports, where pull request wait times are a leading indicator of delivery friction. Teams often assume their problem is slow reviews. In reality, the review itself takes 30 minutes — but the MR sat in a queue for 2 days before anyone opened it.
Common antipatterns:
- No clear reviewer assignment — MRs sit in a shared queue that everyone ignores
- Reviewers are overloaded (each reviewer has 8+ open MRs assigned)
- Teams work across time zones without accounting for review handoff delays
- MR notifications drown in Slack noise
What to fix:
- Assign reviewers explicitly at MR creation (use CODEOWNERS or round-robin)
- Set a team SLA: "Every MR gets a first review within 4 business hours"
- Create a dedicated review channel or dashboard — not a Slack thread
- Monitor Pickup Time as a team metric, not an individual metric
Stage 3: Review Time
Definition: From the first review action to the merge request being approved and ready to merge.
What it captures: The back-and-forth of code review — comments, discussions, requested changes, and follow-up commits.
Healthy range: 4–24 hours for most changes. Multi-day reviews usually signal either large MRs or architectural disagreements that should have been resolved earlier.
Common antipatterns:
- Large MRs (1000+ lines) that take multiple rounds of review
- "Approval gatekeeping" — only one senior engineer can approve, and they're in meetings all day
- Nit-picking style issues that could be caught by automated linters
- Review ping-pong: reviewer requests changes → developer pushes fix 2 days later → reviewer re-reviews 1 day later
What to fix:
- Enforce MR size limits (most teams see optimal throughput at 200–400 lines)
- Automate style and formatting checks (linters, formatters in CI)
- Expand the pool of approved reviewers — invest in enabling mid-level engineers to review
- Set expectations for re-review turnaround (same day)
Stage 4: Deploy Time
Definition: From merge request approval to code running in production.
What it captures: The CI/CD pipeline execution, staging validation, manual approval gates, and the actual deployment process.
Healthy range: Under 1 hour for Elite teams. Under 1 day for High performers.
Common antipatterns:
- Manual deployment windows ("we deploy on Tuesdays")
- Slow CI pipelines (45+ minutes) that block the merge queue
- Manual QA gates that require sign-off from a specific person
- Deploy freezes that stack up changes and increase batch risk
What to fix:
- Invest in CI speed: parallelize tests, cache dependencies, use faster runners
- Move to continuous deployment with feature flags instead of release trains
- Replace manual QA gates with automated smoke tests and canary deployments
- Track deploy queue length — if 10 MRs are waiting to deploy, that's a problem
Benchmark Data: Where Teams Actually Lose Time
Based on the DORA State of DevOps reports and industry research (consistent with patterns described in Forsgren, Humble, and Kim's Accelerate, 2018), here's where time typically goes for a team with a 10-day Lead Time:
| Stage | Typical % of Lead Time | Typical Duration | Biggest Lever |
|---|---|---|---|
| Coding | 30–40% | 3–4 days | Smaller tickets, clearer specs |
| Pickup | 25–35% | 2.5–3.5 days | Reviewer assignment, SLAs |
| Review | 15–25% | 1.5–2.5 days | Smaller MRs, automation |
| Deploy | 10–15% | 1–1.5 days | CI/CD speed, remove gates |
The takeaway: Pickup and Review together consume 40–60% of Lead Time in most organizations. These are process problems, not technical problems. They don't require new infrastructure — they require new habits.
How to Measure Each Stage
Option 1: Manual Tracking (Not Recommended Long-Term)
You can calculate stages from git and your code hosting platform:
- Coding Time: First commit timestamp → MR creation timestamp
- Pickup Time: MR creation timestamp → first review comment/approval timestamp
- Review Time: First review action → final approval timestamp
- Deploy Time: Final approval → deployment timestamp (from CI/CD logs)
This works for a one-time audit. It breaks down at scale because timestamps live in different systems, edge cases are messy (draft MRs, force-pushes, re-reviews), and nobody wants to maintain a spreadsheet.
Option 2: Automated Platform
Tools like PanDev Metrics connect to your Git provider (GitLab, GitHub, Bitbucket, Azure DevOps) and calculate all four stages automatically. The advantage isn't just automation — it's consistency. Every team uses the same definitions, the same edge-case handling, and the same benchmarks.
PanDev also correlates Lead Time stages with IDE heartbeat data. This means you can distinguish "Coding Time where a developer is actively writing code" from "Coding Time where a branch sits idle for 3 days because the developer is pulled into incident response."
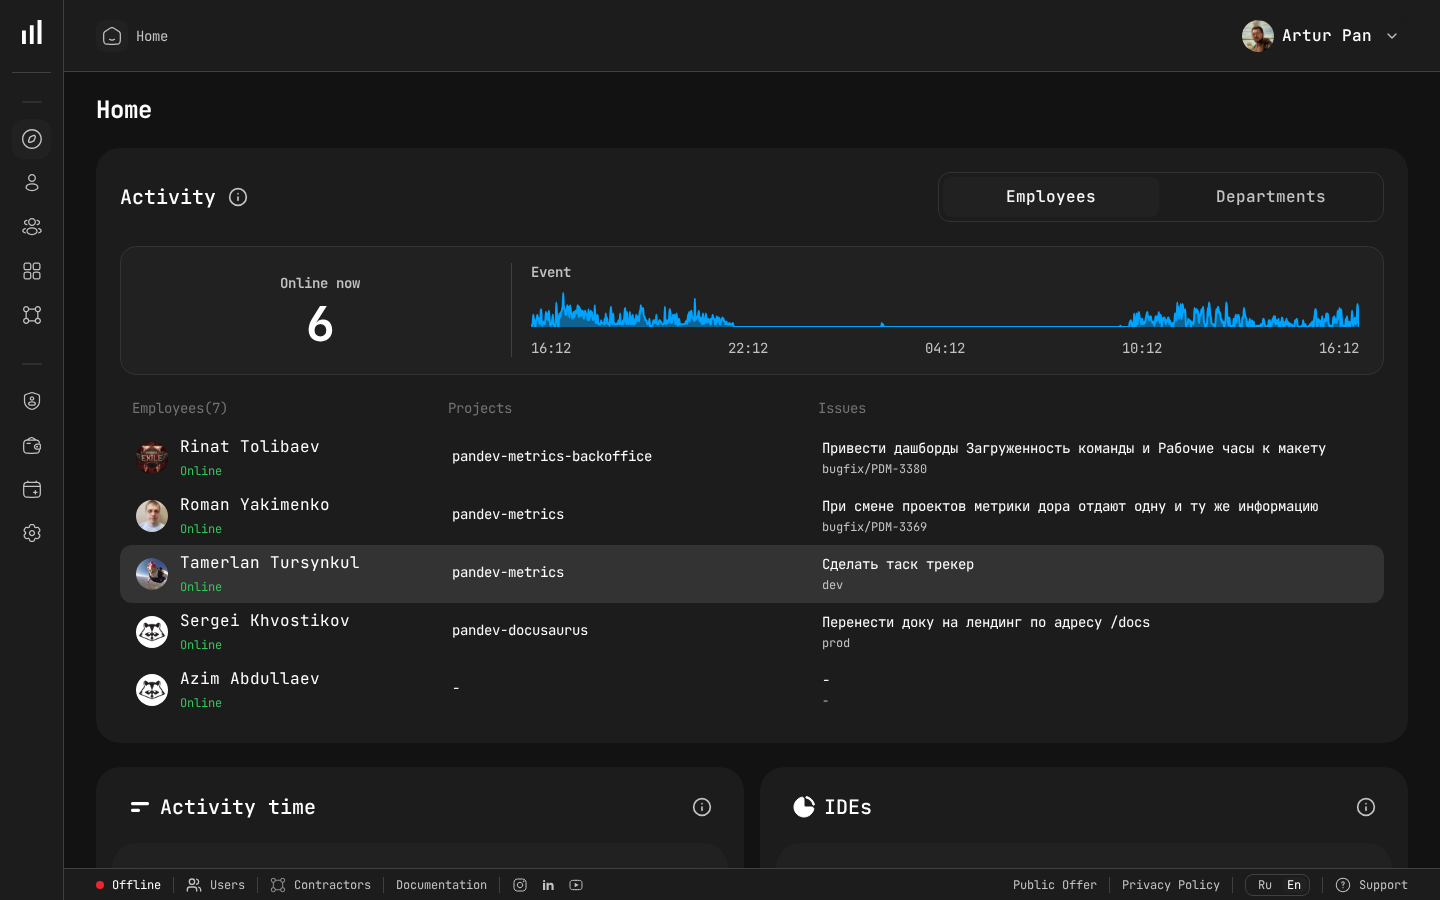 PanDev Metrics team dashboard — track activity, online status, and event timeline to correlate Lead Time improvements with team behavior.
A Real Improvement Playbook
Here's a step-by-step approach that works for most teams with a Lead Time over 7 days:
Week 1: Measure and baseline
- Set up stage-level tracking for all MRs merged in the last 90 days
- Identify which stage consumes the most time
- Present findings to the team without blame — frame it as "where does our process create wait time?"
Week 2: Fix Pickup Time (usually the biggest win)
- Implement explicit reviewer assignment
- Set a team SLA (e.g., first review within 4 business hours)
- Create visibility: a dashboard showing "MRs waiting for review" with age
Week 3–4: Fix Review Time
- Introduce MR size guidelines (under 400 lines)
- Add linters and formatters to CI to eliminate style-related review comments
- Expand the reviewer pool
Week 5–6: Fix Deploy Time
- Audit CI pipeline duration — target under 15 minutes
- Remove or automate manual approval gates
- Move toward deploying each MR independently
Expected results: Teams following this playbook typically reduce Lead Time by 40-60% within 6 weeks, consistent with improvement rates observed in the DORA research. The biggest gains come from Pickup Time — it's common to go from 3 days to 4 hours just by assigning reviewers and tracking the SLA.
What About Coding Time?
Coding Time is the hardest stage to compress because it depends on the complexity of the work. However, two interventions consistently help:
-
Smaller scope per ticket. If the median MR is 800 lines, the Coding Time reflects a large scope. Breaking tickets into smaller deliverables (200–400 lines) shortens each cycle.
-
IDE activity tracking. Tools that capture developer heartbeats (keystrokes, file saves, build triggers) can distinguish between "actively coding" and "blocked." If a developer's branch shows zero activity for 2 days mid-coding, something is wrong — and it's probably not laziness. It's a blocker, a context switch, or a missing dependency.
PanDev Metrics captures IDE heartbeats from 10+ IDE plugins (VS Code, JetBrains, Eclipse, Xcode, Visual Studio, and more) specifically to provide this visibility — not for surveillance, but for identifying systemic blockers.
Common Mistakes When Measuring Lead Time
Mistake 1: Measuring from ticket creation, not first commit. Ticket creation captures planning time, which is a product management metric, not a delivery metric. DORA Lead Time starts at first commit.
Mistake 2: Excluding weekends and holidays. The clock doesn't stop for customers waiting for a fix. Measure calendar time. If weekends distort your numbers, that tells you something useful about your deployment process.
Mistake 3: Only measuring "happy path" MRs. Exclude reverted MRs or hotfixes and you lose the most informative data points. Measure everything, then segment.
Mistake 4: Averaging instead of using percentiles. A mean Lead Time of 3 days might hide a bimodal distribution: 50% of MRs merge in 1 day, 50% take 5 days. Use p50, p75, and p95 to understand the real distribution.
Mistake 5: Treating Lead Time as an individual metric. Lead Time is a team metric. Using it to evaluate individual developers creates incentives to game the numbers (small cosmetic MRs, skipping tests, avoiding complex work).
From Measurement to Improvement
The goal of measuring Lead Time in stages is not to produce dashboards. It's to make better decisions about where to invest engineering effort in process improvement. When you can see that 35% of your Lead Time is Pickup Time, you stop debating whether to rewrite the CI pipeline and start fixing reviewer assignment.
Measurement without action is overhead. Action without measurement is guessing. The 4-stage breakdown gives you the resolution to do both.
Benchmarks cited from the DORA State of DevOps Reports (2019–2023) published by Google Cloud / DORA team.
Ready to see where your Lead Time actually goes? PanDev Metrics breaks down Lead Time into Coding, Pickup, Review, and Deploy stages automatically — for GitLab, GitHub, Bitbucket, and Azure DevOps. Start measuring what matters →