Lead Time for Changes: DORA's Most Misunderstood Metric

Roughly 80% of the engineering teams I've reviewed in the last year report a "Lead Time" number that DORA wouldn't recognize. They measure ticket-creation-to-release. DORA measures something narrower and harder to game: first commit to production. The gap between those two definitions is often 5–10 days, and it's the difference between an honest delivery metric and a dashboard that flatters the wrong people.
This guide pins down the strict DORA definition, gives you the formula, separates Lead Time from Cycle Time (they're not synonyms), and shows the 2026 elite/high/medium/low bands you can benchmark against.
{/* truncate */}
Lead Time for Changes — the DORA definition
The DORA research program (Forsgren, Humble, Kim, codified in Accelerate, 2018) defines Lead Time for Changes as:
The time it takes a code change to go from first commit on a feature branch to running in production.
That's it. Not ticket creation. Not requirements gathering. Not deployment-window approval. The clock starts on the first git commit and stops when that commit's code is serving real traffic.
Two things follow from this definition:
- Lead Time is a delivery metric, not a product metric. It measures engineering throughput, not how long a feature took from idea to user impact. The product-side equivalent ("idea to delivered value") is sometimes called Concept Lead Time or Time to Market. Different metric, different audience.
- It includes everything that happens to a commit after it's written. Code review queue time, CI runtime, manual QA, deploy gates, release-train batching: all of it counts. If your developer commits on Monday and the code reaches prod on Friday, your Lead Time is 4 days, regardless of how "ready" the code was on Monday.
The 2023 State of DevOps Report (the last major release before this writing) treats Lead Time as one of the four core DORA metrics, alongside Deployment Frequency, Change Failure Rate, and MTTR. The four are designed to be read together, and we'll come back to that contradiction at the end.
The Lead Time formula
In plain pseudocode:
lead_time(change) = production_deploy_timestamp(change)
                  - first_commit_timestamp(change)
For a team-level number, aggregate over a window (usually 30 or 90 days) and report a percentile, not a mean:
lead_time_p50 = median of lead_time(c) for c in deployed_changes(last_90d)
lead_time_p75 = 75th percentile (this is what DORA reports)
lead_time_p95 = tail (catches the outlier MRs that block release)
DORA uses p75 by default. Means are misleading because the distribution is almost always right-skewed. 80% of MRs ship fast, 20% drag on, and the average sits in a meaningless middle.
A few subtleties that trip teams up:
- "First commit" means first commit on the branch that eventually merges. Squash-merge throws this away. You need the pre-squash history or you'll think every change took 5 minutes.
- "Production deploy" means actually serving traffic. If you deploy to a staging or pre-prod environment and sit there for 2 days, those 2 days are part of Lead Time.
- Reverted changes still count. If a commit was deployed and rolled back, Lead Time is measured to the original deploy timestamp. The rollback itself becomes a separate signal: it'll show up in Change Failure Rate.
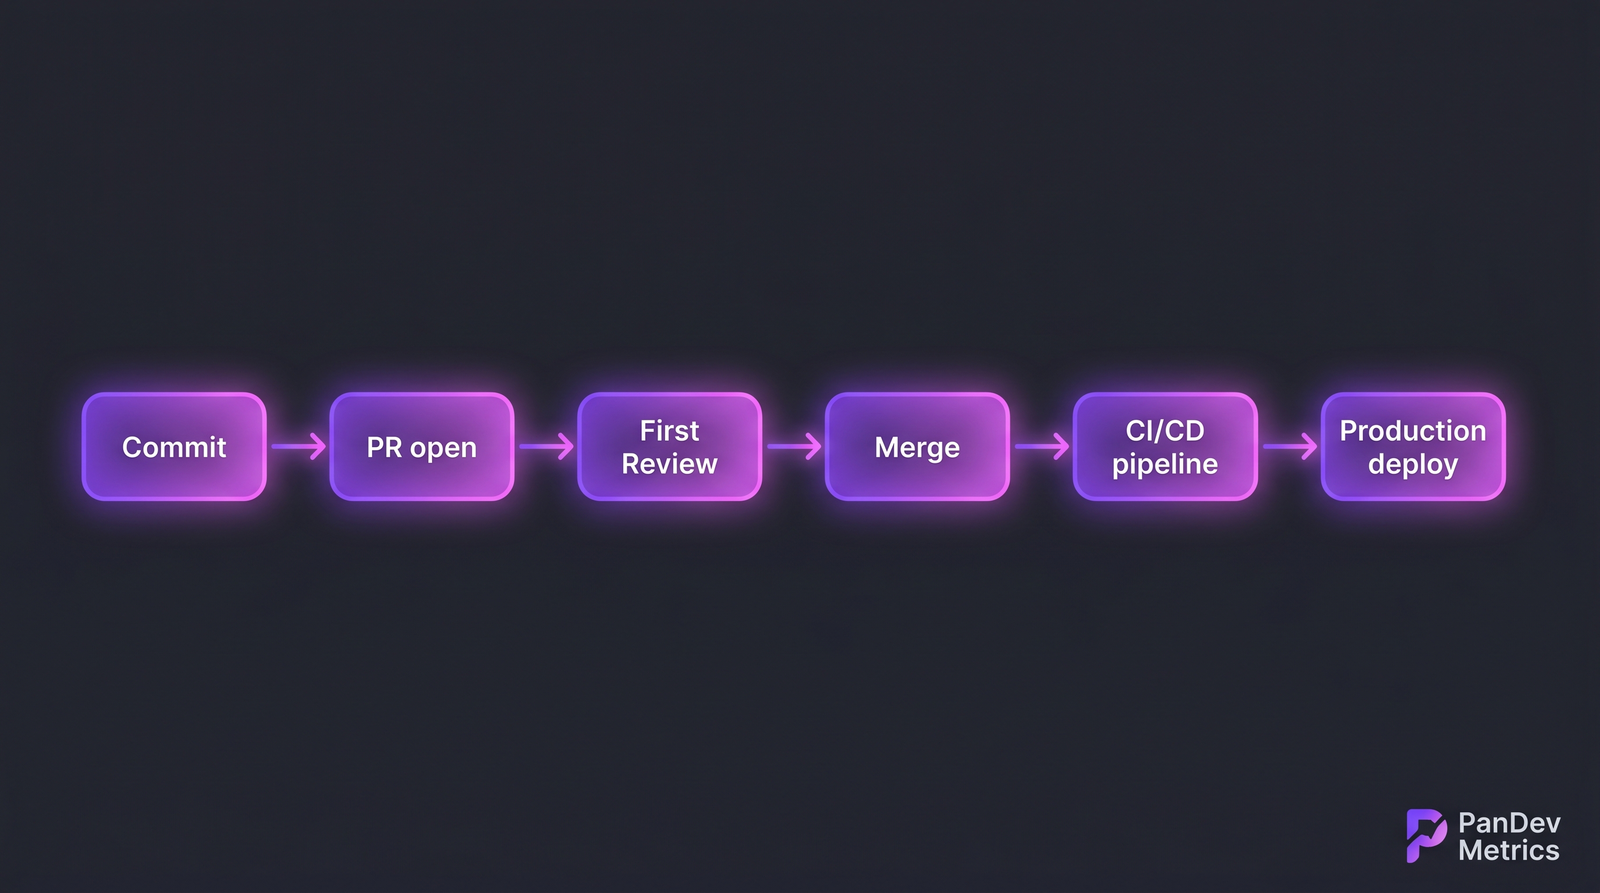 The DORA clock runs end-to-end across all six stages, not just the active coding part.
Lead Time vs Cycle Time
These two terms get used interchangeably and they shouldn't be. The shortest accurate answer is that Cycle Time is a subset of Lead Time.
| Dimension | Lead Time (DORA) | Cycle Time (lean / Kanban) |
|---|---|---|
| Start point | First commit | Work officially started (status → "In Progress") |
| End point | Code in production | Work officially done (status → "Done" or merged) |
| What it measures | End-to-end delivery throughput | Active work duration |
| Includes deploy time? | Yes | Usually no |
| Includes review queue? | Yes | Yes |
| Origin | DORA / Accelerate | Lean manufacturing → Kanban |
| Typical p75 | 1 day – 1 month | Hours – days |
A team can have a 2-day Cycle Time and a 14-day Lead Time if their merge-to-deploy stretch is governed by a weekly release train. The Cycle Time looks healthy. The Lead Time tells you customers wait two weeks for a fix.
DORA picked its definition for exactly this reason: it's the one customers actually feel.
2026 benchmarks: elite, high, medium, low
The bands below come from the DORA State of DevOps Reports (2019–2023), which we treat as still authoritative in 2026 absent a major new release. Match your p75 against the relevant row.
| Performance level | Lead Time (p75) | What it usually looks like |
|---|---|---|
| Elite | Less than 1 hour | Trunk-based development, full CI/CD, feature flags instead of release branches |
| High | 1 day to 1 week | Feature branches with same-day review, automated deploys, light manual QA |
| Medium | 1 week to 1 month | PR review queues with multi-day waits, batched releases, some manual gates |
| Low | More than 1 month | Long-lived branches, scheduled release windows, heavy manual approval chains |
A few honest caveats on these bands:
- The "Elite" band is unrealistic for regulated industries. Fintech, healthcare, and govtech teams often run hard manual compliance gates that put a floor of 1–3 days on every deploy. They can hit "High", not "Elite", and that's fine.
- Distributions matter more than the band. A team with a p50 of 6 hours and a p95 of 11 days has a tail problem worth fixing, not an "average" problem.
- The 2023 report numbers are aggregated across thousands of orgs. Your industry, codebase age, and team size all skew the realistic target.
Where Lead Time goes wrong (the bottleneck map)
When a Lead Time of 12 days lands on a CTO's desk, the natural question is where did the 12 days go. Five places, in roughly the order they show up in real data:
1. PR review queue (the silent killer). Across the B2B engineering teams we've looked at, the gap between MR-opened and first-review is consistently the largest single chunk of Lead Time, frequently 2–4 days. The MR is ready. Reviewers are busy. Nothing is wrong with the code. The clock just runs.
2. Merge conflicts on long-lived branches. A branch that lives 5 days accumulates 5 days of conflicts. Resolving them adds hours and often triggers a re-review.
3. CI flakiness. A 30-minute pipeline that fails 20% of the time on flaky tests has an effective duration of ~45–60 minutes per merge, not 30. Multiply across a team and a week, and you've burned days.
4. Manual QA gates. A "QA must sign off" step adds 4–48 hours per deploy depending on QA's queue depth. For regulated industries this is unavoidable. For most product teams it's a habit, not a requirement.
5. Production deploy gates. Release windows ("we only deploy on Tuesdays"), change advisory boards, and freeze periods can add 1–7 days. They exist for reasons that often haven't been re-examined since the company was 10x smaller.
For a full bottleneck breakdown by stage (Coding / Pickup / Review / Deploy), see our earlier 4-stage Lead Time decomposition. The 4-stage view is the diagnostic layer on top of the headline number.
How to cut Lead Time by 50% (a realistic playbook)
This isn't theoretical. These are the levers that move the number, ordered by typical impact-to-effort ratio.
- Set a reviewer SLA of 4 business hours. Pick one rule: every MR gets a first reviewer assigned at creation, and that reviewer commits to a first response within 4 business hours. In our customer data this single rule routinely cuts p75 Lead Time by 30–50%.
- Cap MR size at 400 lines of diff. Large MRs take longer to review and take longer to come back to after the first round. Smaller MRs ship in cycles, not batches.
- Make CI green in under 15 minutes. Parallelize, cache, kill the flaky tests. A 45-minute pipeline is a 45-minute hostage situation.
- Replace release trains with feature flags. Decouple deploy (technical event) from release (product event). Deploy continuously, release on a schedule. Lead Time drops to whatever CI takes.
- Audit your manual gates. For each one, ask: what failure mode is this catching? How often has it caught it in the last 12 months? If the answer is "we don't know," it's a candidate for removal.
A blunt contrarian point: teams that optimize Lead Time without watching Change Failure Rate end up shipping fast garbage. The 4 DORA metrics are designed to be read as a pair. Throughput (Deployment Frequency, Lead Time) against stability (Change Failure Rate, MTTR). Cut Lead Time from 10 days to 1 day, watch CFR climb from 8% to 25%, and you've made the system worse, not better. We've broken this trade-off down separately in Change Failure Rate: Is 15% Actually Normal?.
An honest limit
Lead Time is gameable. The most common way is to make MRs artificially small. A one-line cosmetic change has a Lead Time of an hour, and if your team starts ranking on the metric, you'll see a sudden epidemic of tiny commits. The metric improves; delivery doesn't.
This is why DORA insists on reading Lead Time alongside Deployment Frequency (volume) and Change Failure Rate (quality). A team that ships 5x more changes with a 2x shorter Lead Time and the same CFR has genuinely improved. A team that ships 5x more tiny changes with the same total throughput has gamed the dashboard.
It's also worth saying: PR size and team architecture matter. A team that just split a monolith into microservices will see Lead Time drop almost overnight, not because they got faster, but because each service has a smaller deploy surface. The metric isn't lying. It's just measuring a different system.
FAQ
Lead Time это что? Lead Time for Changes — это DORA-метрика, измеряющая интервал от первого commit'а на ветке до момента, когда этот код работает в production. Чистая инженерная метрика throughput.
Lead Time и Cycle Time — одно и то же? Нет. Cycle Time — подмножество Lead Time. Cycle Time стартует, когда задача переходит в "In Progress" (lean / Kanban), Lead Time — с первого commit'а. Lead Time всегда включает merge-to-deploy stretch, Cycle Time — обычно нет.
Какой нормальный lead time? По 2023 State of DevOps Report: Elite — менее часа (p75), High — от 1 дня до 1 недели, Medium — от 1 недели до 1 месяца, Low — больше месяца. Для regulated industries (fintech, healthcare) реалистичный таргет — High, не Elite.
Как измерять lead time без специальных инструментов?
Минимум: Git API (или git log) для timestamp'а первого commit'а на ветке + CI/CD логи для timestamp'а deploy'а в prod. Рассчитайте deploy_ts - first_commit_ts для каждого merge'нутого PR, агрегируйте за 90 дней, возьмите p75. Это работает для разового аудита. Не масштабируется, потому что edge-кейсы (squash-merge, force-push, reverted PR'ы) ломают наивную формулу.
Что входит в lead time для DORA? Всё, что происходит с commit'ом после его создания: код-ревью, merge, CI, staging, manual QA, deploy в production. Не входит: время на формулирование задачи, оценку, спецификацию, и любая работа до первого commit'а — это product-side метрики.
Related reading
- DORA Metrics in 2026: Complete Guide — все четыре метрики в одном месте
- Lead Time: 4-Stage Breakdown — диагностика по стадиям Coding / Pickup / Review / Deploy
- Deployment Frequency: From Monthly to Daily — почему частые деплои меняют Lead Time
- Change Failure Rate: 15% Normal? — стабильность как контрагент throughput'а
- DORA vs SPACE vs DevEx (2026) — куда Lead Time вписывается в более широкие фреймворки
One implementation note. PanDev Metrics computes Lead Time directly from your Git history and CI/CD events: first commit timestamp on the merged branch, deploy timestamp from the pipeline. No manual ticket tagging, no spreadsheet maintenance, no edge-case bookkeeping. The four-stage decomposition (Coding / Pickup / Review / Deploy) is automatic across GitHub, GitLab, Bitbucket, and Azure DevOps. The one workflow rule we ask of customers (branch names with task IDs like feature/PROJ-324) exists so we can join the Git side of the data to your task tracker. Everything else falls out of the commits.