Loaded Hourly Rate: Why Your Engineer Costs 50% More Than Their Salary

A senior backend engineer in Almaty earns $5,000/month gross. A CFO scoping a new project does the obvious math: $5,000 ÷ 160 = $31.25/hour. That number lands in a spreadsheet, then in a board deck, then in a quote sent to a customer.
The real cost of that engineer's hour, after overhead, is closer to $46/hour. That's a 48% gap. The 2024 DORA State of DevOps Report puts non-coding overhead at 35–55% of engineering payroll across high-performing organizations. McKinsey's Developer Velocity Index (2023) lands in the same range. Most companies never multiply through. They quote, scope, and forecast on the naive number, then wonder why the books don't close.
{/* truncate */}
The naive formula and where it breaks
The default cost-per-hour is monthly_salary / 160. The 160 is the European/Kazakhstan working-month convention: roughly 8 hours × 20 working days. PanDev Metrics uses the same constant in its dual-rate engine. When a department defines a developer's compensation as MONTHLY ($/month), the system converts to HOURLY internally as rate / 160.
That's the direct rate. It's correct for what it represents: a finance-grade conversion of paid salary into per-hour terms.
What it ignores:
- The middle manager's salary the dev reports to.
- The DevOps engineer keeping the staging environment alive.
- The HR partner who runs onboarding.
- The 4 hours per week the dev spends in meetings and code review (which produce no commits, but produce no nothing either).
- The 2 weeks per quarter spent on incident response, ramp-up on a new project, or research spikes.
None of this shows up on the engineer's payslip. All of it is real money the company pays so the engineer can do the work that does show up. Conventional accounting calls this overhead. Engineering leaders who don't multiply it in are quoting fiction.
Stack Overflow's 2024 Developer Survey reported a global median of 41.7 hours/week declared work, of which roughly 40–60% was actual coding. The rest goes to meetings, planning, learning, and waiting on dependencies. Translate that to monthly billable: somewhere between 64 and 96 hours of "real" output per 160 paid. Salary divided by paid hours under-prices the productive hour by a factor of 1.5 to 2.5.
The loaded rate formula
The accounting-standard formula:
loaded_rate = direct_rate × (1 + K)
Where K is the overhead coefficient: the ratio of indirect cost to direct productive work. PanDev Metrics computes K via the OverheadCoefficientService:
K = adminSalary / (taskTotal + nontaskTotal)
Three components:
- taskTotal: sum of money tied to coding hours that are tagged to a tracker task (Jira issue, ClickUp task, etc.). This is direct work the customer or product team can name.
- nontaskTotal: sum tied to coding hours without a task. Meetings, code review, research spikes, ramp-up, incident triage. Real engineering output, just not feature-attributable.
- adminSalary: fixed monthly cost of management and operations. Tech leads' management time, EM/director payroll, DevOps platform engineers, IT, recruiting cost amortization. Anything paid that isn't a developer producing code.
Typical K ranges across our customer base: 0.20–0.60. A K of 0.30 means every $1 of direct dev cost carries $0.30 of organization overhead. A K of 0.55 means almost half again on top.
Worked example: a senior engineer in Almaty
Senior backend developer, $5,000/month gross.
| Step | Number |
|---|---|
| Monthly salary | $5,000 |
| Working hours/month (convention) | 160 |
| Direct hourly rate | $31.25 |
| Department K (March 2026, computed) | 0.48 |
| 1 + K | 1.48 |
| Loaded hourly rate | $46.25 |
The K of 0.48 came from the department's actual books that month:
| Component | Amount |
|---|---|
taskTotal (direct coding tied to tasks) | $20,000 |
nontaskTotal (meetings, review, research) | $9,000 |
adminSalary (EM + DevOps + IT allocation) | $14,000 |
| K = 14,000 / (20,000 + 9,000) | 0.483 |
A 50% gap between naive and loaded is not exotic. It's the normal state of any engineering org with a real management layer.
Why one K-per-org hides the truth
LinearB, Jellyfish, Code Climate, and most DIY spreadsheets use a single averaged K, picked once a year and applied flat across every project, every month, every cost-per-feature report. That works for an annual report. It fails for project quoting and mid-year decisions.
The reason: K moves month-to-month, sometimes sharply.
- Q4 (Oct–Dec):
nontaskTotalspikes from year-end planning, performance reviews, holiday backfill, and re-orgs. K shifts up. - July–August: half the team on PTO.
taskTotalfalls,adminSalaryis constant. K shifts up again, for a different reason. - Post-reorg month: manager headcount jumps before dev headcount catches up.
adminSalaryspikes, K spikes. - Heavy-incident month:
nontaskTotalswallows incident response, K shifts up.
PanDev Metrics computes K per month per department. Cost-per-feature for a feature shipped in November uses November's K, not last year's average. The difference is meaningful: in our customer base we routinely see K oscillate between 0.32 and 0.61 within the same calendar year for the same team. A flat 0.45 average misprices half the months on either side.
This per-month K is what makes the difference between a finance team that reconciles to actuals and one that lives in a fog of "approximately."
Naive vs loaded across a typical engineering org
| Role | Monthly comp | Direct rate | Department K | Loaded rate | Gap vs naive |
|---|---|---|---|---|---|
| Junior | $3,000 | $18.75 | 0.48 | $27.75 | +48% |
| Mid | $5,000 | $31.25 | 0.48 | $46.25 | +48% |
| Senior | $7,000 | $43.75 | 0.48 | $64.75 | +48% |
| Staff | $10,000 | $62.50 | 0.48 | $92.50 | +48% |
| Contractor | $12,000 (invoiced) | $75.00 | 0.10 | $82.50 | +10% |
The contractor row is the one that catches CFOs off guard. A contractor billing through their own LLC carries minimal adminSalary allocation, because they pay for their own management. The K for contractor cost is much lower, sometimes 0.05–0.15 (only the recruitment amortization and PM overhead). On a per-hour basis a $75/h contractor can be cheaper than a "$31/h" senior employee, once both are loaded honestly. That single insight has driven more than one of our customers to rebalance employee/contractor ratios.
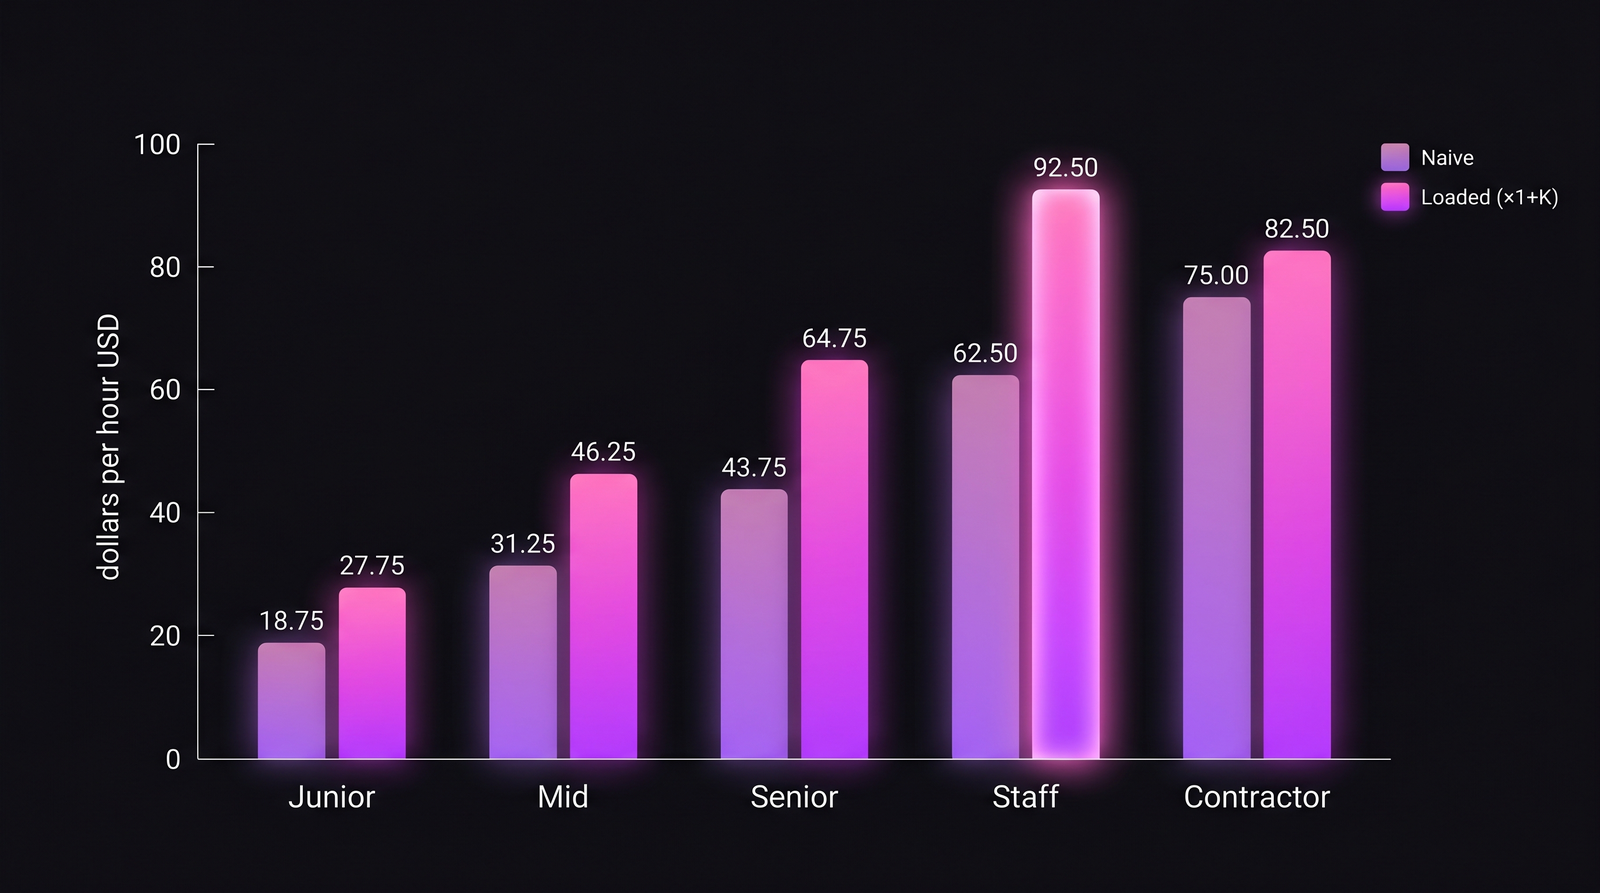 Across the org, the naive rate under-prices every employee role by roughly 48%. Contractors are the exception, and that's the lever most CFOs miss.
Where the K coefficient lives in our product
PanDev Metrics derives K automatically from the data already flowing through the platform: IDE heartbeat data attributes coding minutes to tasks (when the dev is on a task-named branch like feature/PDM-3475) or to non-task work (everything else). Salary and admin allocations are configured once in the Department settings. The OverheadCoefficientService recomputes K nightly. Cost-per-feature, engineering ROI, and project quotes all read the current month's K, not a static value.
This is the same engine behind our hourly rate and cost tracking module, and it's the input layer for cost-per-feature calculations downstream.
In the UI, K shows up as a separate card with month-by-month history. The finance team sees that K was 0.31 in one month and 0.58 in another, and can drill straight into the components: where exactly nontaskTotal grew, which departments drove the adminSalary jump, which project dropped on taskTotal. That level of decomposition is what turns "we run roughly 45% loaded" into an actual audit. From what we've seen with customers, the first quarter on monthly K usually ends an entire category of recurring argument between finance and engineering leadership: one number, one source, one history.
What our model can't tell you
Honest limit: our K-coefficient model assumes you can cleanly separate task vs non-task work via IDE telemetry. If your developers don't follow the branch-naming convention (feature/TICKET-ID), the platform can't tell whether their coding time was task or non-task. Orgs without IDE-level tracking will need to bootstrap K with a manual time-allocation survey for the first 1–2 months (typically a 5-minute weekly self-report), until coverage is good enough to trust the automated number.
Two more limits worth naming:
- Capitalized vs. expensed work. Some accounting regimes (US GAAP) capitalize new-product engineering and expense maintenance. K is the same number; how you book the loaded cost differs. The CFO needs to apply the cap/exp split after the loaded rate, not before.
- Open-source contribution time that benefits the company indirectly (e.g., a dev maintaining a library the product depends on) sits awkwardly. We classify it as
nontaskTotalby default. If your business model requires it to count as direct cost, that's a configuration decision, not a formula one.
What to do this week
- Pull last month's payroll for one department. Sum the dev salaries (this is
dev_total). Sum management + DevOps + IT allocated to that department (adminSalary). - From your tracker, get hours-on-tasks vs hours-not-on-tasks for the same month. Multiply by hourly rates →
taskTotal,nontaskTotal. (If you can't separate them, your floor estimate isnontaskTotal = 25% of dev_total.) - Compute
K = adminSalary / (taskTotal + nontaskTotal). - Re-quote your two largest active projects with the loaded rate. The delta is the margin you didn't know you were giving away.
A flat 50% loading is not the answer for everyone. But assuming zero loading is wrong for everyone. The work is to find your number, monthly, and let the books reflect it.
The hourly rate quoted to a client in May, properly done, comes out of April's K. Not last year's average. Not what the finance director typed into a spreadsheet two autumns ago. Out of last month's actual books, with every spike and dip in them. That's the line between a marketing rate and a financial one.