Logistics Engineering Metrics for Delivery Platform Teams

A delivery platform's engineering team runs a fundamentally different workload from a B2B SaaS team. The courier mobile app pings location every 3-5 seconds. The dispatcher console expects sub-200ms order assignments. Route-optimization jobs crunch combinatorial problems overnight and need to finish before dawn shifts start. A 2024 McKinsey report on last-mile logistics pegged the cost of a single hour of dispatcher downtime at $12,000-$35,000 for a mid-size regional carrier.
This shape of work changes what engineering metrics actually matter. DORA four keys still apply, but the team-health and delivery-performance picture shifts. Here's the metric stack that fits logistics platform teams — and the places where "copy a SaaS DORA dashboard" misleads you.
{/* truncate */}
Why logistics engineering is different
Logistics software has three constraints most SaaS companies never touch:
- Physical-world latency budget. If the courier app freezes for 30 seconds, a package goes to the wrong doorstep. Software delays turn into physical errors with customer, regulatory, and sometimes safety consequences.
- Peak-season traffic cliffs. Black Friday, Chinese New Year, monsoon season — some platforms see 4-7× traffic in a 3-day window. Your capacity plan isn't "how much do we serve on average" but "what do we survive on worst-case day."
- Regulated driver-hours data. In the US, EU, and most of Asia, commercial driver tracking is subject to labor-law and transport-law audits. Mobile app data is evidence. Code changes that touch GPS telemetry go through compliance review, not just code review.
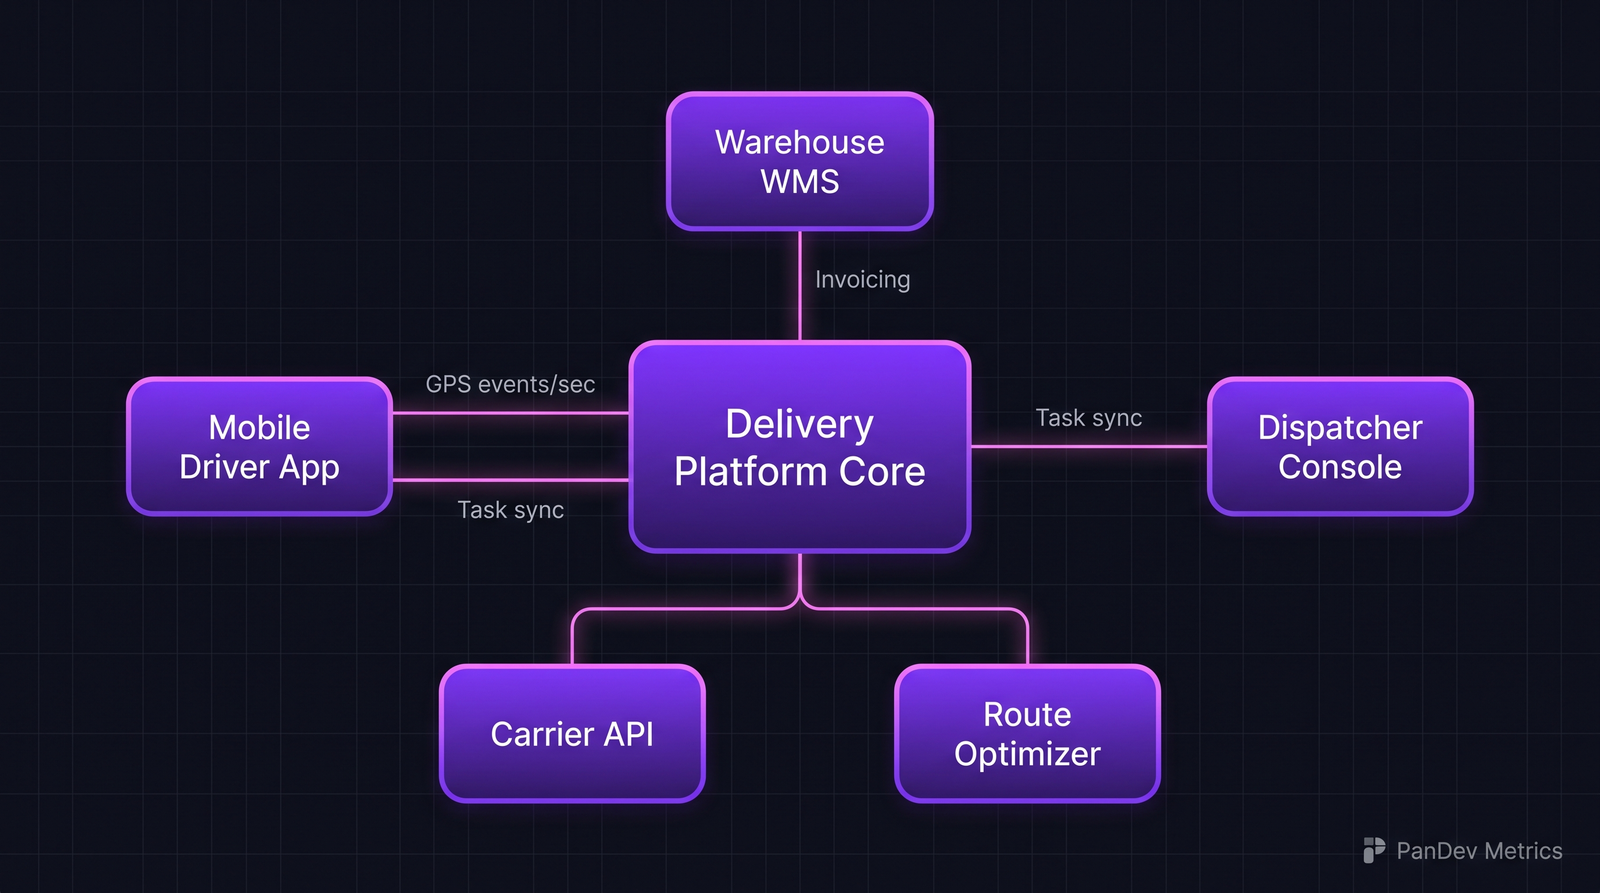 A typical delivery platform architecture. The five surrounding systems each have different latency and reliability budgets, which is why one dashboard won't do.
The metrics that matter here
1. Peak-capacity headroom, not just uptime
Uptime of 99.95% sounds great. It also hides that you're at 92% CPU during Friday 6pm, with nothing left for a 10% traffic spike.
Track peak-hour capacity headroom as a distinct metric:
| Service | Headroom target | Why this number |
|---|---|---|
| Courier tracking ingest | ≥40% spare | GPS bursts spike 5× during rush-hour handoffs |
| Order assignment | ≥25% spare | Sub-200ms target, anything less causes dispatcher queue buildup |
| Route-optimizer nightly | Complete by 04:30 local | Drivers start at 05:00-06:00 shifts |
| Customer app (consumer) | ≥30% spare | Black Friday / flash-sale absorption |
| Admin / analytics | 0-10% OK | Not time-critical, can degrade |
Pinterest's engineering blog (2023) described a "capacity runway" practice — they track how many peak-days away they are from breaching the 70% CPU threshold. For logistics, the same idea: "we are 18 peak-season-days away from a capacity emergency."
2. p95 latency, not average latency
Average latency is the wrong tool for logistics. Amazon's internal research (published by Werner Vogels in 2022) noted that the 95th percentile is what customers remember. One in twenty order assignments taking 2 seconds is enough to train dispatchers to complain.
Track:
| Endpoint | Target p50 | Target p95 | Target p99 |
|---|---|---|---|
/orders/assign | 80ms | 180ms | 350ms |
/courier/heartbeat | 20ms | 60ms | 120ms |
/route/recalculate | 400ms | 1.2s | 2.5s |
/customer/track/{id} | 100ms | 250ms | 500ms |
p50 tells you normal life. p95 tells you the experience. p99 tells you where the pagers fire.
3. Change failure rate, segmented by surface
DORA's change failure rate is usually tracked as one number. For logistics, it hides critical nuance: a failed deploy on a customer-facing tracking page is embarrassing; a failed deploy on the dispatcher console halts operations.
Segment it:
| Surface | Failure-rate tolerance | Rollback expectation |
|---|---|---|
| Dispatcher console | < 5% | Under 2 min |
| Courier mobile app | < 8% | 24h (app-store cycle — requires feature flags) |
| Customer tracking page | < 15% | Under 5 min |
| Internal admin | < 20% | Next-day acceptable |
A single org-wide "change failure rate: 12%" obscures that dispatcher is at 3% (great) while customer page is at 22% (emergency).
4. Mobile app release cadence vs desktop
Mobile app updates can't be rolled back. An iOS release with a broken GPS permission prompt is live for 18-36h minimum. This forces a different deployment cadence:
- Desktop / web: deploy multiple times a day is fine
- Mobile: weekly or bi-weekly cadence, gated by beta rollout, always behind feature flags
The healthy logistics team treats mobile as a distinct DORA unit, with its own deployment frequency, lead time, and change failure rate. Collapsing it into org-wide numbers is the most common misread we see.
5. On-call rotation intensity (driver-impacting only)
Not every page is equal. A dashboard-component alert at 3am is painful. A "couriers cannot log in" alert at 3am is a platform emergency.
Track:
- Driver-impacting incidents per week — target under 2
- Average pages per on-call shift — target under 5
- After-hours deployment rate to courier-facing services — aim for near zero
The last one is contrarian. The DevOps orthodoxy says "deploy frequently, even after-hours." For logistics, after-hours deployments to courier systems carry asymmetric risk: nobody is awake to answer support calls if a driver gets stranded.
How compliance and scale change measurement
Driver GPS data is personal data under GDPR, UK DPA, and many regional laws. Some implications:
- Access logs for GPS telemetry are themselves audit artifacts. The engineer who queried a driver's last-week route needs to be recorded.
- Retention policies for courier location data vary by jurisdiction (6 months in the EU, up to 7 years in some US states for subpoena compliance).
- Change review for anything touching
locations/gps_pointstables should involve a compliance reviewer. That slows your lead time — and that slowdown is correct, not a metric to optimize away.
This is why copying a B2B SaaS DORA dashboard misleads: it incentivizes the wrong behavior in a regulated-data context. Your mean lead time on GPS-touching changes will be slower than your mean lead time on customer UI changes, and that's a feature.
Case pattern: typical logistics platform engineering team
What a ~40-person delivery platform engineering org usually looks like:
| Team | Size | Primary services owned |
|---|---|---|
| Driver / mobile | 6-8 | iOS, Android, mobile backend |
| Dispatcher console | 4-6 | Web console, assignment algorithm |
| Customer experience | 5-7 | Tracking page, notifications, customer app |
| Route & optimization | 3-5 | VRP solver, geo-indexing, ETA service |
| Platform / data | 6-9 | Ingestion, DB, BI pipelines |
| SRE / DevOps | 3-5 | Infra, CI/CD, incident response |
| Integrations | 3-5 | Carrier APIs, warehouse WMS, compliance exports |
The teams that break are usually the Route & Optimization group (small, highly specialized, high on-call intensity) and the Integrations group (invisible until a carrier API changes overnight and breaks Black Friday).
Where PanDev Metrics fits
PanDev Metrics collects IDE heartbeat and Git data across multiple repositories, which matches the multi-service reality of a logistics stack. Two places it's most useful:
- Multi-repo focus tracking — a route-optimizer engineer often touches the VRP solver, the ETA service, and the dispatcher console. IDE telemetry tagged with project context answers "how fragmented is this role really?" — a question self-report surveys can't.
- Peak-season burnout signals — after-hours and weekend coding patterns that cluster around Black Friday or regional peaks show up as exactly the 5-signal pattern we documented in the burnout detection guide. Logistics teams see these patterns earlier and more severely than average.
Honest limit: we don't measure the driver-facing user experience. Our data is about the engineers building the platform, not the couriers using it. Uptime and latency SLOs still come from your APM stack (Datadog, New Relic, Grafana, etc.).